Introduction
The Formal Safety Assessment (FSA) has been frequently conducted on a merchant vessel’s hardware according to the IMO guidelines but rarely on human errors. Regarding the analysis of human errors in marine affairs, Rothblum et al. proposed an effective program for the evaluation of incidents including human factors(Rothblum et al, 2002). Moreover, Griggs proved that the Human Factor Analysis and Classification System (HFACS) was a useful tool to analyze human errors in marine incidents by applying the HFACS and analyzing human errors based on a marine incident report of the U.S. NTSB, Canada’s TSB, and UK’s MAIB, respectively(
Griggs, 2012). Also, Hauff applied the HFACS to human factors in the loss of position (LOP) incidents of dynamic positioning (DP) vessels and analyzed the impact of human errors on DP LOP incidents (
Hauff, 2014). In Korea, the method of employing the HFACS and the Bayesian network to control human errors was proposed on the basis of relevant research on human errors in DP LOP incidents.
In the existing case analyses of DP LOP incidents, the 10-year average of LOP incidents caused by human errors was 11.8%, relatively less than the that of other causes(
Chae, 2015). However, the author examined 612 reports that had been analyzed in the existing studies in detail and found that human errors were direct or indirect causes of 61.2% (375 cases) in LOP incidents.
In this paper, based on the analysis, the FSA is conducted on human errors in DP LOP incidents for the safe operation of DP vessels. To this end, the author aims to quantify major causes of human errors by applying the HFACS and the Bayesian network provided in previous studies to human errors in DP LOP incidents, examine the impact of human errors on DP LOP incidents, and propose the risk control options (RCOs) to mitigate human errors based on a cost-benefit analysis.
Premise and Tools of Research
2.1. Research Premise
The reports of DP LOP incidents that occurred from 2001 to 2010 do not include human injury, collision and property damage. Therefore, in the paper, the FSA is conducted based on the causes of DP LOP incidents caused by human errors and the severity by incident types.
This paper, the FSA is only conducted on 103 DP LOP incident reports which officially identified human errors as the primary and secondary causes of LOP incidents, considering that the analysis of DP LOP incident reports may affect credibility. The types of DP LOP incidents caused by human errors are as in Table
1 with reference to previous studies(
Hauff, 2014).
Table 1
Categorization of DP LOP incidents(Shi, 2005)
|
Type of Incidents |
Definition |
|
Drift off |
Loss of power that causes the vessel to move off location in the direction of the prevailing environment |
|
Drive off |
Powered move away from the desired vessel position. A drive off may occur at full power, due to false position information or wrong position inputs from the operator. |
|
Operation abort |
No LOP, but the DP operation was aborted |
|
Time loss |
No LOP, operation not aborted, Includes reduced system redundancy, where time loss is considered highly probable due to the degraded system |
2.2. Tools Used in the FSA
2.2.1. Brainstorming
Five individuals including the author, two DPOs, a DP vessel supervisor, a Dynamic Positioning Operator (DPO) instructor and an Fail Mode and Effect Analysis (FMEA) expert carried out two rounds of brainstorming in order to determine the following:
2.2.2. HFACS and Bayesian Network
The HFACS on 103 DP LOP incidents caused by human errors was classified based on previous study(
Chae, 2015). Furthermore, in order to identify the prior probability and conditional probability of human errors, the Bayesian network flow chart of LOP incidents caused by human errors was created based on the incident types categorized in Table
1. The MS excel data on the occurrence and non-occurrence of incidents was analyzed with GeNIe, which is a useful program that graphically displays prior probability and conditional probability by reflecting incident data in the flow chart created based on qualitative analysis(
Bayesfusion, 2015).
FSA Application
3.1. Risk Identification
3.1.1. HFACS Classifications
The HFACS classification of 103 cases of human errors in previous study has shown that all human errors of DP LOP incidents occurred due to unsafe acts. And, 40 cases attributable to precondition for unsafe acts (38.8%), 88 cases to unsafe supervision (85.4%), and 68 cases to organizational influences (66.0%)(
Chae, 2015). The means of % in this study is that 103 human errors are considered as 100%, and the percentage of individual human errors is expressed as % which allowed duplication application. Out of the causes of 103 DP LOP incidents caused by human errors, in terms of organizational influences, the inadequacy of established procedures was highest with 54.4%, and the inadequate management of human resources stood at 32.3%. In terms of unsafe supervision, the inadequacy of operational procedures or plans was found to be the biggest cause with 37.5% and the failure to provide oversight was 28.4%. In addition, in terms of the precondition for unsafe acts, a lack of knowledge was highest with 35%, followed by distraction of 20%. Lastly, In terms of unsafe act, skill-based errors accounted for 68.9%, followed by decision errors of 27.2%(
Chae, 2015).
3.1.2. Frequency Analysis of Human Errors
The risk is expressed as multiply of severity and frequency.
The criteria on the severity of DP LOP incidents caused by human errors was established as in Table
2 (
Chae, 2016). And, the criteria on the frequency of human errors was established at five stages as shown in Table
3. The severity referred to the DP LOP categorization of table
1. And, frequency is predetermined criteria based on DP LOP incidents report of IMCA. Accordingly, the risk index on unsafe acts was created as provided in Table
4.
Table 2
Severity Index of human error DP LOP incidents
|
Severity Index (SI) |
|
SI |
Severity |
Effects on DP vessel |
S(equivalent incidents) |
|
1 |
Low severity |
No collision, human injury and environmental damage. small loss of properties. |
Time loss |
|
2 |
Medium severity |
No collision, human injury and environmental damage. middle size loss of properties. |
Operation abort |
|
3 |
High severity |
Collision, human injury and environmental damage occurred. big size loss of properties. |
Drive drift off |
Table 3
Frequency Index of human error DP LOP incidents(Chae, 2016)
|
Frequency Index (FI) |
|
FI |
Frequency |
Definition |
F |
|
5 |
Frequent |
1 LOP during 100hours operation of 1 DP vessel |
10-2
|
|
4 |
Probable |
1 LOP during 1,000hours operation of 1 DP vessel |
10-3
|
|
3 |
Unlikely |
1 LOP during 10,000hours operation of 1 DP vessel |
10-4
|
|
2 |
Remote |
1 LOP during 10,000hours operation of 10 DP vessels |
10-5
|
|
1 |
Very remote |
1 LOP during 10,000hours operation of 100 DP vessels |
10-6
|
Table 4
Risk Index of DP LOP incidents caused Unsafe acts(Chae, 2016)
|
Risk Index (RI) |
|
Unsafe acts |
Number of error |
Frequency |
FI |
RI = FI + SI |
|
Drift off or Drive off SI =3 |
Operation abort SI =2 |
Time loss SI =1 |
|
Skill-based |
70 |
3.68×10⁻³
|
4 |
7 |
6 |
5 |
|
Perceptual |
3 |
1.58×10⁻⁴
|
3 |
6 |
5 |
4 |
|
Decision |
29 |
1.52×10⁻³
|
4 |
7 |
6 |
5 |
|
Routine |
1 |
5.25×10⁻⁵
|
2 |
5 |
4 |
3 |
|
Exceptional |
- |
|
|
|
|
|
|
Total |
103 |
5.41×10⁻³
|
|
|
|
|
Fleet at risk : 19,032 DP vessel years
Frequency = Number of error ÷ 19,032(DP vessel years) |
Fleet at risk is calculated as follows :
A. 365 × 0.7(Operation rates per year) × 0.7(DP Operation rates within Operation rates) = 178.85(days)
B. 38,840 DP vessels(total vessel numbers during 10 years) × 178.85(days) = 6,946,534(days)
C. 6,946,534(days) ÷ 365(days) = 19,032 DP vessel year(IMCA, 1994)
The value of the risk index for each human error caused by unsafe acts in Table
4 can be calculated by identifying the frequency of HFACS-classified human errors and applying the result to Table
2 and Table
3. It indicates that the most dangerous factors in human errors are drift off and drive off caused by skill based errors.
The frequency of human errors caused by unsafe act in Table
4, divided by the severity (SI) of drive off, operation abort and time loss, results in the frequency of human errors caused by unsafe acts by LOP incident types as in Table
5. It was found that the highest risk of DP LOP incidents caused by human errors is drive off resulting from skill-based errors and decision errors (RI 7), followed by drive off (RI 6) resulting from perceptual errors.
Table 5
Frequency of unsafe acts(Chae, 2016)
|
Unsafe acts frequency |
|
Unsafe acts |
Drive off |
Frequency |
Operation abort |
Frequency |
Time Loss |
Frequency |
|
Skill-based |
57 |
2.99×10⁻³
|
1 |
5.25×10⁻⁵
|
12 |
6.31×10⁻⁴
|
|
Perceptual |
2 |
1.05×10⁻⁴
|
- |
|
1 |
5.25×10⁻⁵
|
|
Decision |
21 |
1.10×10⁻³
|
3 |
1.58×10⁻⁴
|
5 |
2.63×10⁻⁴
|
|
Routine |
1 |
5.25×10⁻⁵
|
- |
- |
- |
- |
|
Exceptional |
- |
- |
- |
- |
- |
- |
|
Total |
81 |
4.26×10⁻³
|
4 |
2.10×10⁻⁴
|
18 |
9.46×10⁻⁴
|
Fleet at risk : 19,032 DP vessel years
Frequency = Number of error ÷ 19,032(DP vessel years) |
3.2. Risk Analysis
3.2.1. Cumulative Frequency and F-N Curve
In order to draw the F-N curve, the cumulative frequency of each human error of drive off, operation abort and time loss is calculated as in Tables
6-
8. Cumulative frequency is cumulative frequency of each human errors as it says. A calculation method is shown in Table
6.
Table 6
Cumulative frequency of Drive off by Unsafe acts(Chae, 2016)
|
Cumulative Frequency of Drive off |
|
Unsafe acts |
Drive off |
Frequency (per DP vessel year) |
Cumulative Frequency (per DP vessel year) |
|
Skill-based |
57 |
2.99×10⁻³
|
2.99×10⁻³
|
|
Decision |
21 |
1.10×10⁻³
|
4.10×10⁻³
|
|
Perceptual |
2 |
1.05×10⁻⁴
|
4.20×10⁻³
|
|
Routine |
1 |
5.25×10⁻⁵
|
4.26×10⁻³
|
|
Exceptional |
- |
- |
- |
|
Total |
81 |
4.26×10⁻³
|
|
Fleet at risk : 19,032 DP vessel years
Frequency = Number of error ÷ 19,032(DP vessel years)
Cumulative Frequency = Skill based + Decision + Perceptual + Route + Exceptional |
Table 7
Cumulative frequency of Operation abort by Unsafe acts(Chae, 2016)
|
Cumulative Frequency of Operation abort |
|
Unsafe acts |
Operation abort |
Frequency (per DP vessel year) |
CumulativeFrequency (per DP vessel year) |
|
Decision |
3 |
1.58×10⁻⁴
|
1.58×10⁻⁴
|
|
Skill-based |
1 |
5.25×10⁻⁵
|
2.10×10⁻⁴
|
|
Perceptual |
- |
- |
- |
|
Routine |
- |
- |
- |
|
Exceptional |
- |
- |
- |
|
Total |
4 |
2.10×10⁻⁴
|
|
Fleet at risk : 19,032 DP vessel years
Frequency = Number of error ÷ 19,032(DP vessel years) |
Fig.
1 shows the F-N curve based on Tables
6-
8. Since DP LOP incidents analyzed in this study do not include deaths, property damage and environmental damage, the average value of cumulative frequency of drift off, drive off, operation abort and time loss was applied on the ALARP boundary of the F-N curve. Therefore, the author would like to clarify that the boundary does not refer to social and individual risks but sets the average frequency of DP LOP incidents caused by human errors as the broadly acceptable criteria.
Fig. 1
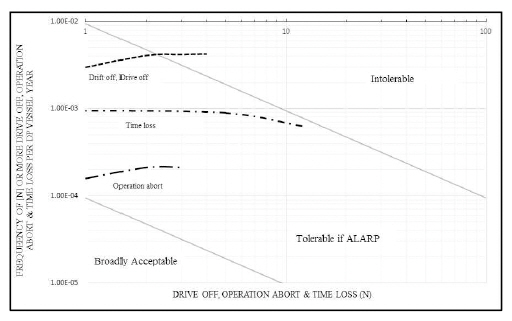
Table 8
Cumulative frequency of Time loss by Unsafe acts(Chae, 2016)
|
Cumulative Frequency of time loss |
|
Unsafe acts |
Time Loss |
Frequency (per DP vessel year) |
Cumulative Frequency (per DP vessel year) |
|
Skill-based |
12 |
6.31×10⁻⁴
|
6.31×10⁻⁴
|
|
Decision |
5 |
2.63×10⁻⁴
|
8.94×10⁻⁴
|
|
Perceptual |
1 |
5.26×10⁻⁵
|
9.46×10⁻⁴
|
|
Routine |
- |
- |
- |
|
Exceptional |
- |
- |
- |
|
Total |
18 |
9.46×10⁻⁴
|
|
Fleet at risk : 19,032 DP vessel years
Frequency = Number of error ÷ 19,032(DP vessel years) |
As Fig.
1, parts of drift off and drive off are beyond the tolerable boundary of ALARP. The ALARP boundary in Fig.
1 does not indicate the broadly acceptable criteria. Therefore, it does not translate into the idea that the risk of the part exceeding the ALARP should be reduced regardless of costs, but the risk of LOP incidents caused by human errors should be reduced in a reasonable method. Risk factors in human errors identified in the frequency analysis are provided in Table
9.
Table 9
Risks Caused by human errors(Chae, 2016)
|
No. |
Risks required RCOs |
Risk Index |
|
1 |
Drive off caused by skill-based errors |
7 |
|
2 |
Drive off caused by decision errors |
7 |
|
3 |
Drive off caused by perceptual errors |
6 |
|
4 |
Drive off caused routine errors |
5 |
|
5 |
Operation abort caused by decision errors |
5 |
|
6 |
Operation abort caused by skill-based errors |
4 |
|
7 |
Time loss caused by skill-based errors |
4 |
|
8 |
Time loss caused by decision errors |
4 |
|
9 |
Time Loss caused by perceptual errors |
3 |
3.2.2. Analysis of Bayesian Network
A flow chart of DP LOP incidents caused by human errors was created with GeNIe based on the HFACS analysis. And, 103 LOP incidents were organized into a MS excel file. Then, the file was run on GeNIe and the prior probability of drift off, drive off, operation abort and time loss was calculated as in Fig.
2.
Fig. 2
Prior Probability of human error on DP LOP incidents

The probability of drift off was found to be 41%, drive off to be 38%, operation abort and time loss to be 11% and 25%, respectively.
Futhermore, the sensitivity of DP LOP incidents was examined with GeNIe, and it was found that skill-based unsafe acts were the most sensitive factors for drift off, drive off, operation abort & time loss as shown in Fig.
3. In terms of the precondition for unsafe acts, physical and mental problems had the biggest impact.
Fig. 3
Human errors sensitivity for drift off, drive off, operation abort & time loss

Also, the conditional probability of drift off, drive off, operation abort and time loss was examined based on Fig.
2, and one of the result of the conditional probability for drift off is shown in Fig.
4.
Fig. 4
Conditional probabilities of Drift off & drive off by Human error
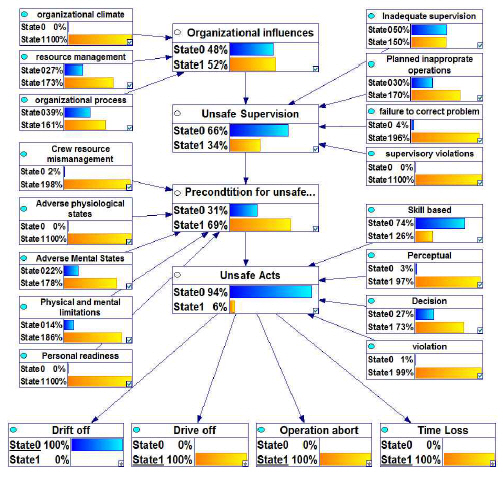
As in Fig.
4, when conditional probability is examined with probability of drift off 100%, the causes of human errors in drift off were identified as unsafe acts (94%), preconditions for unsafe acts (31%), unsafe supervision (66%), and organizational influences (48%). In this regard, DP LOP incidents that have occurred in the past decade can be mainly attributed to drift off caused by unsafe acts. Moreover, human errors caused by unsafe acts were mainly due to the absence of appropriate supervision and inadequacy of established procedures rather than a lack of operators’ mental readiness, physical constraints, and a lack of preparation. Such results are similar to those of the above frequency analysis of incidents.
So far, the frequency analysis based on the HFACS and the Bayesian network were conducted on 103 DP LOP incidents caused by human errors. The factors that mainly affect DP LOP incidents were found to be as in Table
10.
Table 10
Summary of risks caused by human errors(Chae, 2016)
|
Risks RCOs required |
|
Drive off |
Drive off caused by skill-based errors(74.3%)
Drive off caused by unsafe supervision(50.5%)
Drive off caused by organizational procedure (38.8%)
Drive off caused by resource managements(27.2%)
Drive off caused by decision errors(27.0%)
Drive off caused by adverse mental states(21.8%)
Drive off caused by adverse physiological states(14.2%) |
|
Opertion abort |
Operation abort by skill-based errors(51.9%)
Operation abort by unsafe supervision(50.5%)
Operation abort by organizational procedure errors(38.8%)
Operation abort by planned inappropriate operations(30.1%)
Operation abort by decision errors(27.8%)
Operation abort by resource managements(27.2%)
Operation abort by adverse mental states(24.1%)
Operation abort by adverse physiological states(15.6%) |
|
Time loss |
Time loss by skill-based errors(64.0%)
Time loss unsafe supervision(50.5%)
Time loss organizational procedure(38.8%)
Time loss by planned inappropriate operations(30.1%)
Time loss by decision errors(27.4%)
Time loss by resource managements(27.2%)
Time loss adverse mental states(22.9%)
Time loss adverse physiological states(14.9%) |
The biggest cause of LOP incidents caused by human errors is skill-based human errors, which are highly affected by inadequate supervision and organizational influences.
3.3. Risk Control Methods
The triangle of effectiveness is applied to control risks of human errors identified in the HFACS and the Bayesian network. Created based on the HFACS, it models 8-step measures to prevent or reduce human errors and the impact of each measure as in Fig.
5(
Rothblum et al., 2002).
Fig. 5
Triangle of effectiveness to reduce human error

Out of the 8-step factors, the biggest factors that affect risk control are policies, culture and workplace design. Therefore, it would be effective to propose changes in such parts with regard to the RCOs for human errors.
With reference to such findings, brainstorming was used to determine the RCOs to prevent or reduce risks of human errors identified in the HFACS classification and the Bayesian network as in Table
12. The RCOs for brainstorming were created in advance and proposed in a meeting, and the agreement was sought on proposed RCOs. It is inefficient to apply all RCOs agreed upon in brainstorming. Therefore, the priority of RCOs was set as in Table
11 based on expert concordance coefficient, considering items found to be highly risky in the frequency analysis and major human errors identified in the Bayesian network.
Table 11
Priority of RCOs for Human errors
|
HFACS |
High |
Medium |
Low |
|
Organizational influences |
A1, A2, A4 |
A3 |
A5 |
|
Unsafe supervision |
B1, B2, B6 |
B3, B4 |
B5 |
|
Precondition for unsafe acts |
C1, C2, C5 |
C3, C4 |
|
|
Unsafe acts |
D1, D3, D4 |
D2 |
|
In terms of expert concordance coefficient, the formula on concordance coefficient level provided in MSC 83/INF. 2 was used(
IMO, 2007). The formula is as follows.
In terms of the expert concordance coefficient W on each RCO codes, RCO A stood at 0.78, RCO B at 0.91, RCO C at 0.88 and RCO D at 0.83. According to the IMO guidance, concordance coefficient of W > 0.7 is considered adequate(
IMO, 2007). Out of the proposed RCOs, all experts agreed that if DP simulators (B6, D1, D3 and D4) are installed on a vessel, risks of human errors can be reduced in various ways.
For Table
11 and
12, the RCOs related to policies and organizational culture were mainly selected, and they can be classified into eight factors of the triangle of effectiveness as shown in Table
13.
Table 12
RCOs for Human errors (Chae, 2016)
|
HFACS |
Code |
RCOs |
P |
|
Organizational influences |
Resource Management |
A1 |
Mandatory DPO training through STCW Convention |
1 |
|
A2 |
Establish of DPO selection and performance assessment procedures |
2 |
|
A3 |
Development and application of design guidance to minimize human errors |
4 |
|
Process |
A4 |
Establish procedure of update for DP operation procedures and its application |
3 |
|
A5 |
Establish procedure to check of effective DP operation supervision |
5 |
|
Unsafe supervision |
Inadequate Supervision |
B1 |
Establish procedure to check DPO familiarization of DP operation guidance |
2 |
|
B2 |
Establish of official procedure forDPO operation supervision and additional arrangement of supervision if necessary |
3 |
|
B3 |
Establish of DPO assessment and capability improvement procedure |
4 |
|
B4 |
Establish of detail DPO on board/onshore training procedure |
5 |
|
Planned Inappropriate Operations |
B5 |
Use of developed DP operation procedure tools (TAM, SMOP etc. ) |
6 |
|
Failed to Correct a known Problem |
B6 |
Conduct of DP operation emergency response simulation training |
1 |
|
Precondition for unsafe acts |
Adverse Mental States |
C1 |
Establish of periodical DPO duty change procedure |
2 |
|
C2 |
Situation awareness training through Leadership & Team work course |
3 |
|
C3 |
Establish procedure for optimum human resource arrangement on bridge for safe operation of DP vessels |
4 |
|
C4 |
provide adequate hours of restand relaxation facility |
5 |
|
Crew Resource Mgt. |
C5 |
Establish qualification procedure for English skill when DPO recruitment |
1 |
|
Unsafe acts |
Skill-based |
D1 |
Install the DP simulator on board and Conduct prior training before star ttasks |
1 |
|
D2 |
fill in DP operation procedure checklist and periodical confirm during operation |
4 |
|
Decision |
D3 |
Development of various DPoperation scenarios and provide simulation training of each scenarios |
2 |
|
D4 |
Development of emergency response for DP operation and conduct training |
3 |
Table 13
Triangle of effectiveness categorization
|
Code |
RCOs Polices, Culture |
|
A1 |
Mandatory DPO training through STCW Convention |
|
A4 |
Establish procedure of update for DP operation procedures and its application |
|
B1 |
Establish procedure to check DPO familiarization of DP operation guidance |
|
B2 |
Establish of official procedure for DPO operation supervision and additional arrangement of supervision if necessary |
|
B5 |
Use of developed DP operation procedure tools(TAM, SMOP etc.) |
|
C1 |
Establish of periodical DPO duty change procedure |
|
D2 |
Fill in DP operation procedure checklist andperiodicalconfirm duringoperation |
|
RCOs Workplace Design |
|
D1 |
Install the DP simulator on board and Conductpriortraining before starttasks |
|
RCOs Personalselection |
|
A2 |
Establish of DPO selection and performanceassessmentprocedures |
|
RCOsTraining/SOPs |
|
C2 |
Situation awareness training through Leadership&Teamworkcourse |
|
D3 |
Development of various DP operation scenariosandprovide simulation training of each scenarios |
|
D4 |
Development of emergency response for DPoperationand conducttraining |
Experts agreed that the application of proposed RCOs may reduce risks as follows.
A. RCO A1: Since 30% of DPOs get on board without a DPO certificate issued by the NI, mandatory DPO training may reduce risks by 30%.
B. RCOs A4 and B1: Updating the DP operational procedures that continue to be established in the industry and raising awareness of DPOs on such procedures may reduce human errors by 20%.
C. RCOs B2: Since a number of human errors are attributable to unsafe supervision, adequate supervision of DP operation may reduce risks by 30%.
D. RCOs B5: The professional system on the DP operational procedures may reduce risks by 30% (It refers to professional DP operational procedures different from those provided in the RCO A4)
E. RCOs C1 and D2: While monitoring is already conducted in the operation of DP vessels, considering that 20% is perfunctory, more thorough monitoring by a supervisor may reduce risks by 20%.
F. RCOs D1, D3 and D4: It was agreed that getting accustomed to the tasks through task simulations using simulators installed on the main vessel in advance would be effective and may reduce the frequency and risk of human errors by 50%.
G. RCOs A2, C2 and C5: The continuous evaluation of DPO’s capabilities and training on recognizing situations, making decisions and managing bridge resources may reduce risks by 20%.
The amount of risk reduced by proposed RCOs is shown in Table
14. The F-N curve based on the agreed amount of reduced risk is shown in Fig. 8. However, since there is a limit to reducing human errors by brainstorming due to its qualitative nature, further research on quantification is invited in this regard.
Table 14
Risk reduction rates through RCOs
|
Risk reduction rate through RCOs |
|
RCOs |
Types of RCOs |
Risk reduction rates |
HFACS categories |
|
A1 |
Polices, culture |
30% |
Resource managements |
|
A4 |
20% |
Inadequate supervision |
|
B1 |
20% |
Inadequate supervision |
|
B2 |
30% |
Inadequate supervision |
|
B5 |
30% |
Planned inappropriate operations |
|
C1 |
20% |
Adverse mental states |
|
D2 |
20% |
Skill-based |
|
D1 |
Work place design |
50% |
Skill-based |
|
A2 |
Personal selection |
20% |
Process |
|
C5 |
Training/ SOPs |
20% |
Physical/Mental limitations |
|
D1-1 |
50% |
Skill-based |
|
C2 |
20% |
Adverse Mental status |
|
D3 |
50% |
Decision |
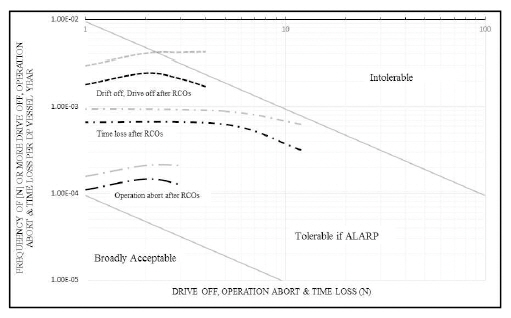
In Fig.
6, it was found that applying the proposed RCOs can have drift off and drive off within the tolerable if ALARP boundary. This means that the proposed RCOs are reasonable measures to reduce the frequency of DP LOP incidents caused by human errors. Considering that there can be deviation in the brainstorming results of experts, in terms of applying the proposed RCOs, the simultaneous application of a number of RCOs can basically maximize the amount of reduced risk. For instance, installing DP simulator can enable the simultaneous application of training on prior simulations (50% reduction), training on emergency response (20% reduction), training on better decision making (50% reduction), and training on skill-based errors (50% reduction), thereby reducing the risk of DP LOP incidents caused by human errors by 50% or more based on expert opinions.
Fig. 6
3.4. Cost-benefit Analysis
The GCAF is applied to identify cost benefits of the proposed RCOs(
IMO, 2007). Since costs are not incurred the proposed RCOs except for the RCOs A1 and D1, the cost-benefit analysis is only applied to the RCOs A1 and D1. The cost-benefit analysis was conducted as follows.
A. The expected amount of reduced risk from mandatory DPO training through brainstorming was applied at 30%.
B. The expected amount of reduced risk from installing DP simulators through brainstorming was applied at 50%.
C. The costs for installation and maintenance of simulators were identified by DPS manufacturers (△C, the costs incurred from the application of the RCOs, will be calculated with the NPV)(IMO, 2007).
D. The GCAF on the RCOs was calculated(IMO, 2007).
In this case,
ΔR = Amount of reduced risk throughout the use of simulators
ΔPLOP = Amount of reduced the risk of potential DP LOP incidents after the application of RCOs
Xt = Costs or benefits during time t when RCOs were applied
A = Initial costs for the application of RCOs
r = Depreciation costs (10% is applied to simulators and the costs are not applied to DPO trainings)
T = Period during which DP simulators can be used (10 years) or the effective period of DPO training (5 years)
3.4.1. RCO A1
If mandatory DPO training is required in accordance with the STCW Convention, training expenses are identified at USD 10,000 per person, and there are no maintenance costs or depreciation costs. Based on the information, the cost-benefit analysis was conducted, and as a result, the GCAF was identified at USD 1,234,568 as in Table
15.
Table 15
Cost-benefit assessment for RCO A1(Chae, 2016)
|
RCOA1 |
Initial F |
% Reduction |
F Reduction |
PLOP |
|
Drive off |
4.26×10⁻³
|
30% |
1.28×10⁻³
|
2.98×10⁻³
|
|
Operation abort |
2.10×10⁻⁴
|
30% |
6.31×10⁻⁵
|
1.47×10⁻⁴
|
|
Time loss |
9.46×10⁻⁴
|
30% |
2.84×10⁻⁴
|
6.62×10⁻⁴
|
|
Total |
5.41×10⁻³
|
|
1.62×10⁻³
|
3.79×10⁻³
|
|
Risk reduction △R |
Cost(US$) △C |
GCAF(US$) |
|
RCOA1 |
8.1×10⁻³
|
10,000 |
1,234,568 |
According to the IMO guidance, the GCAF of USD 3,000,000 US$ or less is considered to be cost effective(
IMO, 2007). Therefore, mandatory DPO training is reasonable in terms of cost benefits.
3.4.2. RCOs D1, D3, D4
The initial installation cost of DP simulators was identified at USD 1,000,000 by manufacturers, and 1-year maintenance costs at USD 10,000, and depreciation costs at 10%, respectively. Accordingly, the cost-benefit analysis on the installation of DP simulators was conducted, and as a result, the GCAF was identified at USD 20,717,552.
Table 16
Cost-benefit assessment for RCO D1(Chae, 2016)
|
RCOD1 |
Initial F |
% Reduction |
F Reduction |
PLOP |
|
Drive off |
4.26×10⁻³
|
50% |
2.13×10⁻³
|
2.13×10⁻³
|
|
Operation abort |
2.10×10⁻⁴
|
50% |
1.05×10⁻⁴
|
1.05×10⁻⁴
|
|
Time loss |
9.46×10⁻⁴
|
50% |
4.73×10⁻⁴
|
4.73×10⁻⁴
|
|
Total |
5.41×10⁻³
|
|
2.71×10⁻³
|
2.71×10⁻³
|
|
|
Risk reduction △R |
Cost(US$) △C |
GCAF(US$) |
|
RCO D1 |
2.71×10⁻²
|
561,446 |
20,717,552 |
The GCAF on the installation of DP simulators is effective in reducing risks in that it exceeds USD 3,000,000. However, in terms of cost benefits, ship owners should make reasonable decisions on installing DP simulators.
3.5. Recommendations
Based on the FSA conducted on human errors in DP LOP incidents, the recommendations to reduce such errors are as follows(
Chae, 2016).
A. Mandatory DPO trainings (RCO A1) : DPO trainings are recommended under Section B-V/f of the STCW Convention. Therefore, relevant trainings should be made mandatory in accordance with the “requirements for education and training on crews boarding specific vessels” in Section A-V of the STCW Convention
B. Installation of a DP simulator (RCOs D1, D3 and D4) : DP simulators should be installed on a main vessel for task simulations in order to reduce the risk of potential incidents in the actual operation
C. Awareness and update of the procedures on safe DP operation(A2, A4, B1, B2 and B5)
Conclusion
This study conducted the FSA based on the HFACS and the Bayesian network on DP LOP incidents caused by human errors for safe operation of DP vessels, and the conclusions are follows
First, the conditional probability of drift off and drive off caused by skill-based errors was the highest with 74.3%, respectively, and the conditional probability of drift off, drive off, operation abort and time loss caused by unsafe supervision was also high with 50.5%. Therefore, it was found that skill-based errors and unsafe supervision are highly likely to result in incidents.
Second, the F-N curve based on the frequency analysis and the Bayesian network shows that parts of drift off and drive off are beyond the reasonably tolerable risk of LOP incidents caused by human errors. In order to reduce the risk of DP LOP incidents caused by human errors, the RCOs were proposed including providing mandatory DPO training in accordance with the STCW Convention, installing DP simulators, drawing up measures to understanding the procedures for safe operation of DP vessels, updating the procedures. Furthermore, it was found that the application of proposed RCOs reduced the risk of LOP incidents caused by human errors by approximately 50%.
Third, as a result of applying the agreed RCOs, it was proven that the drift off and drive off were within the acceptable range on the F-N curve. Moreover, out of the proposed RCOs, it was found that mandatory DPO training is reasonable in terms of cost benefits, and that while installing DP simulators can significantly reduce risks.
Fourth, the HFACS and the Bayesian network were found to be useful tools for the risk analysis of incidents caused by human errors in the FSA on human errors.
In addition to this study, much research should be conducted on establishing the criteria for social and individual risks in order to determine the acceptable range of risks on the F-N curve, and applying vessel incidents caused by human errors to various types of vessels.
Acknowledgements
This paper is based on dissertation thesis of Chong-Ju Chae, titled ‘An Application of FSA for Safe Operation of Dynamic Positioning Vessels’
REFERENCES
1 Bayesfusion, L.L.Data Analytics, Mathematical Modeling, Decision Support (2015). http://www.bayesfusion.com/#!downloads/rxu9q.
2 Chae, C.J.“A study on Human Error of DP vessels LOP Incidents.” Journal of the Korean Society of Marine Environment & Safety, (2015), Vol. 21, No. 5, pp. 516-522.

3 Chae, C.J. ?oAn Application of FSA for Safe Operation of Dynamic Positioning Vessels ??, Navigation System Engineering.. Busan: KMOU; (2016), p. 90-93.
4 Dynamic Positioning CommitteeDP operations guidance, prepared through the Dynamic Positioning Committee of the Marine Technology Society to aid in the safe and effective management of DP operations. (2012.
5 Griggs, F. J.2012), A Human Factors Analysis and Classification System(HFACS) Examination of Commercial Vessel Accidents Naval Postgraduate school; Monterey, California.
6 Hauff, K. S.2014), Analysis of Loss of Position Incidents for Dynamically Operated Vessels Norwegian University of Science and Technology, Department of Marine Technology.
7 International Maritime OrganizationConsolidated text of the Guidelines for Formal Safety Assessment for use in the IMO rule-making process. (2007.
8 IMCARisk analysis of collision of Dynamically positioned support vessel with offshore installation.. (1994), p. 16-20.
9 Rothblum, A. and Wheal, D.Improving Incident Investigation through Inclusion of Human factors. (2002), United States Department of Transportation Publications & Papers.
10 Shi, P.Case Study of DP Vessels Performing SIMOPS, DYNAMIC POSITIONING CONFERENCE 2005.


 PDF Links
 PubReader
 Full text via DOI
 Download Citation
 Print
Print


