

1. Introduction
Marine-based industries are very important in the local economy for municipalities surrounding the sea. In recent years, many municipal governments have recognized them as a new future industry and made efforts to specialize in the industry that matches the characteristics of the region. The national government has also taken interest in new maritime industries such as shipbuilding, equipment, seafood processing and marine biotechnology, including marine leisure sports(Ministry of Oceans and Fisheries, 2014).
In particular, it is promoting added value and job creation through maritime industrial clusters by utilizing idle land parcels around harbors and thus developing the maritime industry. It is also seeking to implement a convergence cluster through the integration of new maritime industries, which are beyond traditional port functions including cargo work, storage and clearance. To this end, the government is systematically supporting and fostering maritime industries to expand port functions. In 2017, it officially announced the First Basic Plan for Clusters and selected Busan Port and Gwangyang Port as the first pilot areas. However, limited space and incentive systems at the level of a general industrial complex and limited space revealed limitations in application as maritime clusters. Looking at the case of forming clusters around the world, high added value is being created through shipping and port industries. For example, in the case of the Port of Rotterdam in Europe, the port industry is recognized as an important industry since it accounts for 61% of the total value added in the Netherlands. The Port of Singapore in Asia is also creating 47% of value added through shipping and support service industries(Kim, 2011). In addition, the port industry accounts for 34%, and the added value, which corresponds to 80% of the national industry, arises from the maritime industry. On the other hand, in Korea, the contribution of maritime industries, centering on harbors, to added value creation is mainly made by the shipping industry, and the overall level of added value is low. Therefore, it can be said that all maritime-related industries, including shipping, port and subsidiary industries are not composed in harmony.
Jeollanamdo, which is the subject of this study, covers an area of 12,335㎢ and occupies 12.4% of the national land, and its administrative districts include 16 port cities and counties. There are 2,165 islands belonging to Jeollanamdo, which accounts for 65%, and the coastline extends 6,743㎞, constituting 45% of the whole country(Jeollanamdo, 2018). In Jeollanamdo, there are 4 trade ports and 11 coastal ports. It is the first in the nation’s aquatic production and fourth in exports. Recently, Jeollanamdo has set its vision of “Leading Area for Logistics, Tourism and Future Industry in Northeast Asia” and aimed to create a hub for marine cultural tourism in Northeast Asia as a center of the expansion of logistics, traffic and information network.
In this study, the structural analysis of maritime-based industries, including port industry, shipping and logistics industry, fisheries, shipbuilding and equipment industry, and marine tourism and leisure industry was carried out on Jeollanamdo, which aims to develop into a leading area for logistics, tourism and future industry in Northeast Asia and create new added value. The purpose of this study is to analyze the industrialization and effect of the maritime industry in Jeollanamdo, and to use it to establish maritime industry policy. For analysis, the combination of location quotient (LQ), shift-share analysis and industrial growth change were applied in this study.
2. Analysis of Previous Studies
Studies on the value added of the maritime industry have been conducted mainly in maritime industry research. The Ministry of Oceans and Fisheries(2001) has established the “Basic Program for Ocean Development (Ocean Korea 21)” and promoted policies for the in earnest. This program has a significance in that it has systematically investigated the for the first time in Korea as a comprehensive plan related to the ocean rather than an analysis on the maritime industry. The Ministry of Oceans and Fisheries(2006) assessed Korea's maritime power through “Future national Ocean Strategy Research” and designed the future vision of maritime administration system for future vision, ocean strategy and implementation from a long-term perspective.
Meanwhile, studies related to maritime special economic zone are currently in early stages and mainly focus on trend analysis, and there are few specific analysis on the maritime industry. Huh(2013) proposed a plan to designate North Port area as a maritime special economic zone in order to solve the problems of hollowing out and sluggish regional economy due to the transfer of freight volume caused by the development of Busan New Port. He emphasized the need for the establishment of a special law and designation of a pilot district, the advancement of R&D and industrial function in the North Port, and the strengthening of linkage between the North Port maritime special economic zone and the industrial clusters in the southeast region. Park(2013) mentioned the necessity of preemptive responses by establishing a development plan for the designation of maritime special economic zone in Gyeongsangnamdo based on the shipping industry infrastructure with focus on the contents of maritime special economic district regulations and tasks for improvement. The Ministry of Oceans and Fisheries(2014) presented the grounds for introducing clusters and laid the foundation for establishing the first basic plan as a direct study on the clusters. In that research, redefined maritime industry classification criteria. Also, the value added to the maritime industry in Korea and the analysis of the structure of the maritime industry were conducted to select maritime industrial cluster. Kim and Lee(2015) analyzed key industry sectors and possible areas for clusters to be introduced in Incheon Port through the maritime industry classification and the analysis of the industrial structure. Song(2015) divided factors for the successful introduction of maritime special economic zone into subjective factors, industrial environment factors and government policy factors through surveys. He suggested that tenant companies should ensure their competitiveness by securing concentrated market strategies and pro-market capabilities to achieve the successful development of maritime industry clusters. Shin(2010) suggested an approach to build the shipping business cluster in order to concentrate shipping business industries and attract high value added firms.
The previous studies have pointed out that the analysis of maritime industry centered on ports. In the maritime industry, added value created from the port is important, but the industry of the port's hinterland should also be taken into account. In this respect, there has been little research on the maritime industry analysis of the entire province where the port is located. Therefore, in this study, Jeollanamdo province, which has four trade ports and 11 coastal ports, and develop competitive power as a industrial location, was selected as the research subject. The maritime industry was extracted from the whole industry in Jeollanamdo province, and the industry which has a competitive edge in Jeollanamdo province was derived using the location quotient and shift-share analysis method. Based on the results, the industry with a competitive advantage is to be derived for the construction of maritime industry clusters in the future and the growth potential of maritime industry in Jeollanamdo province.
3. Classification of Maritime Industry
3.1 Definition of maritime industry
The maritime industry is defined as "maritime fisheries industry" pursuant to Article 3 (3) of the 「Framework Act on Marine Fishery Development」. The maritime fisheries industry refers to the industry related to the management, conservation, development and utilization of marine and marine fishery resources. The specific scope and contents are summarized in the Table 1.
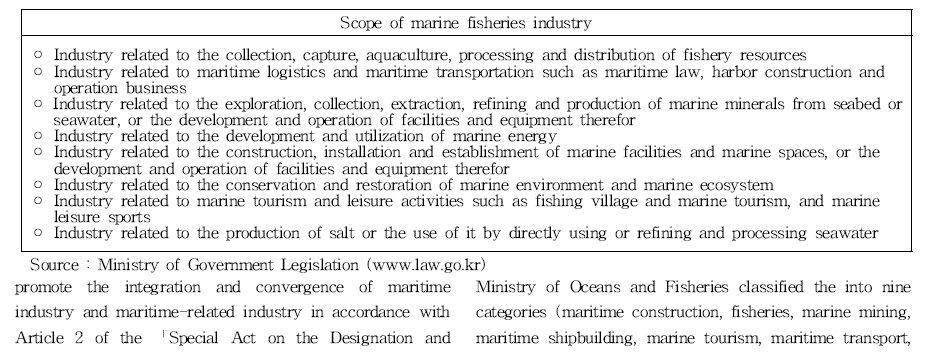
The definition of the maritime industry varies slightly from country to country. In the United States, the industry that directly or indirectly uses the ocean as inputs is classified as a maritime industry, and Australia defines the maritime industry as an activity that uses marine resources or creates added value from the marine environment (Ministry of Oceans and Fisheries, 2014). Ultimately, the meaning of the maritime industry has been gradually expanded by the classification according to the scope of the maritime industry.
The recently introduced maritime industry cluster is the area established around the idle port facilities in order to promote the integration and convergence of maritime industry and maritime-related industry in accordance with Article 2 of the 「Special Act on the Designation and Development of Clusters」and refers to the designated area pursuant to Article 9 of the same Act. The maritime-related industry refers to the industry prescribed by Presidential Decree as a business which has great linkage effects with the maritime industry or high possibility of advancement through convergence.
3.2 Reclassification of Maritime Industry
The 9th Korean Standard Industrial Classification has been used since its revision in 2008 from the Korean Standard Industrial Classification. This includes the classification of maritime industry. In the Korean Standard Industrial Classification, the maritime-related industry is distributed into various industries such as fishery, mining, manufacturing, transportation, wholesale and retail business, sports and service industries. This poses considerable difficulties in the classification of maritime industry.
To solve these problems, the Ministry of Oceans and Fisheries has classified the maritime industry into six major categories (maritime policy, shipping port, fisheries, maritime safety, maritime environment, and maritime science and technology) and 21 subdivisions through expert interviews and surveys to determine maritime manpower requirements(Ministry of Oceans and Fisheries, 2002). Lim(2009) divided the into four major categories (maritime service, maritime manufacturing, marine resources, and maritime research and education) and subdivided it into 11 divisions (fisheries, marine mining, maritime equipment industry, shipbuilding industry, maritime construction, maritime transport, port industry, marine tourism, marine fisheries R&D, marine defense and public administration, and marine fisheries education). Even after that, the promote the integration and convergence of maritime industry and maritime-related industry in accordance with
Article 2 of the 「Special Act on the Designation and Ministry of Oceans and Fisheries classified the into nine categories (maritime construction, fisheries, marine mining, maritime shipbuilding, marine tourism, maritime transport, maritime equipment, research and development, and renewable energy industry) based on the review of overseas classification system. The Busan Metropolitan City has established the classification standard for the in accordance with Article 18 of the 「Busan Metropolitan City Ordinance on Promotion of maritime industry」. Kim and Lee(2015) classified the maritime industry into six categories (shipping and port logistics, fisheries, maritime science and technology, shipbuilding, marine tourism, and other maritime industries), 29 divisions and 107 groups in connection with the Korean Standard Industrial Classification codes. In recent years, the Ministry of Oceans and Fisheries has established pilot areas for maritime industry clusters and redefined the maritime industry into nine major categories and 42 sub-categories based on the Korean Standard Statistical Classification and the maritime industry classification by major countries.
The classification system of the maritime industry varies depending on statistical methods and classification standards by country in the world. Since the classification standards differ from country to country, there is a slight difference in the calculation of value added in the maritime industry, and the application of the classification can vary according to the promotion policies by country. As mentioned above, as the classification standard in Korea changes, the estimation of added value varies depending on the time of research.
In 2009, the value added in Korea's was estimated to be about 69.7879 trillion won(KMI, 2009) based on the annual output. This accounted for 8% of the gross domestic product(GDP) of Korea. In 2010, the Ministry of Oceans and Fisheries reported that the total value added of domestic was 54.375 trillion won in 2007, accounting for 5.6% of the GDP of Korea(Ministry of Oceans and Fisheries, 2010). In 2014, the Ministry of Oceans and Fisheries estimated that the value added in the maritime industry is 43 trillion won, and the maritime industry accounts for 3.4% of the total industry in Korea. Especially in this case, as industries corresponding to indirect effects in the classification standard were excluded from the classification of the maritime industry, the proportion of the decreased. The proportion of the maritime industry in the GDP was the highest in the U.K. with 4.2%, followed by Spain with 2.9%, EU with 4.0%, and Ireland with 0.8%(Juan, C. et al., 2013). It shows a similar level to that of Korea, and the proportion of direct maritime industry is rather low. Therefore, it can be confirmed that there is a difference in the added value estimation according to the classification standard and scope of the maritime industry.
The maritime industry is a specialized industrial sector which integrates a wide variety of other industries. Therefore, there is a limit to the classification of the maritime industry with the existing statistical classification into manufacturing and service industries. In other words, if general industries with low relevance is included in the calculation of value added in the maritime industry, the value added of the maritime industry may be overestimated. So, there is a limit to the result of analysis depending on how to classify the maritime industry. In order to secure reliability, the maritime industry was reclassified with reference to industries classified by the Busan Metropolitan City Ordinance.
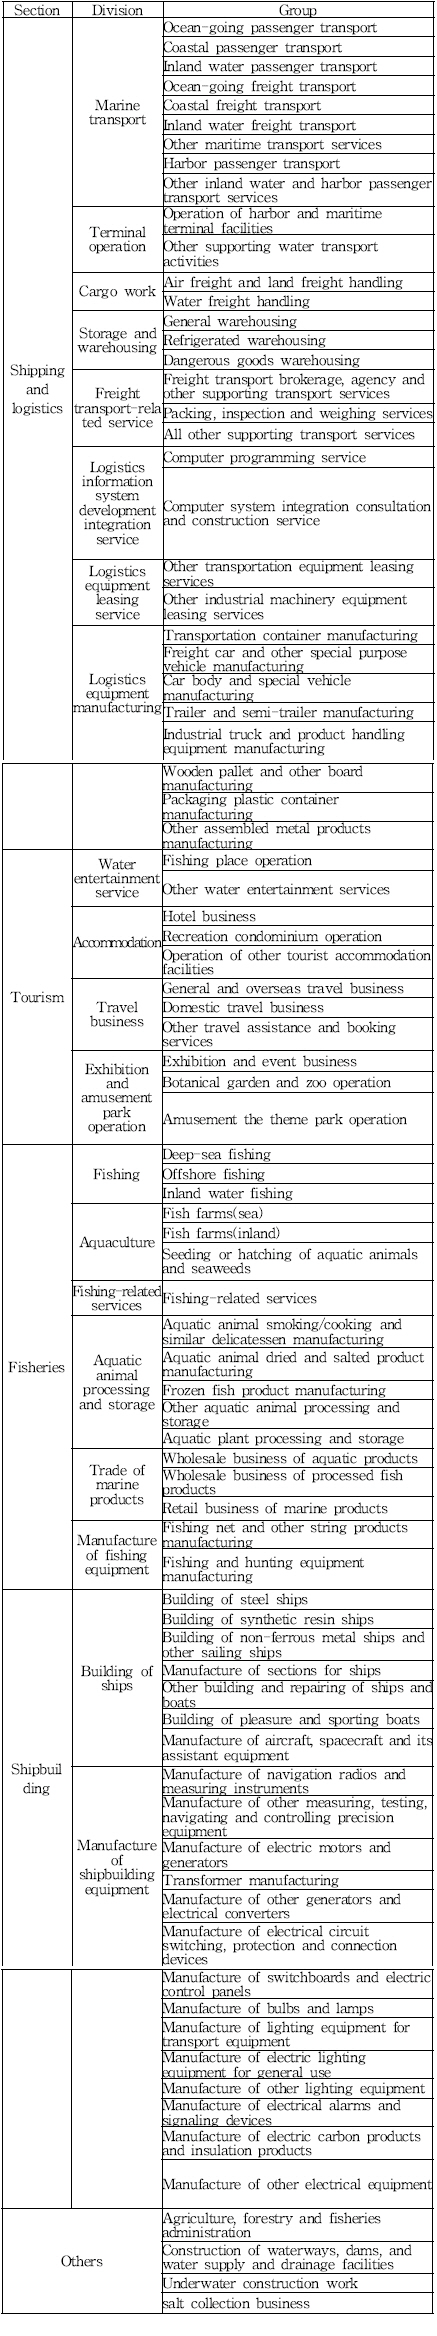
Therefore, in this study, the maritime industry was reclassified as shown in the Table 2 based on the Korean Standard Industrial Classification Code by referring to the Busan Metropolitan City Classification and Logistics Industry Specialized Classification. That is, the maritime industry was classified into five sections (shipping and logistics, shipbuilding, fisheries, tourism and others). The five categories were subdivided into 21 divisions by the Korean National Statistical Office. Also, by using the National Standardiztion Code of the National Statistical Office, we classified them into 84 groups and analyzed them using these statistical data. However, in this study, maritime construction, maritime R&D, marine biotechnology and renewable energy industry in the existing maritime industrial sectors classified based on the statistical classification codes were excluded because a comparative analysis may be difficult due to the influence of industry with much larger market scale such as construction, biotechnology and energy industry.
4. Structural Analysis of in Jeollanamdo Province
4.1 General status
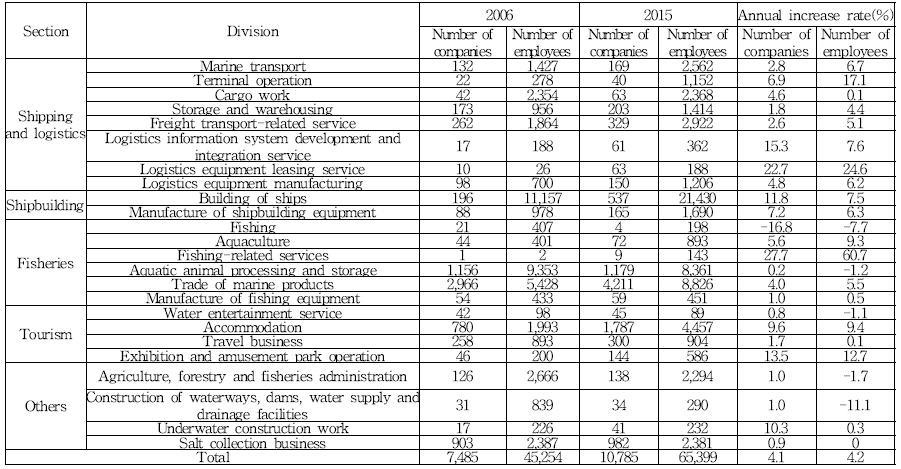
In this study, the status of maritime industry in Korea was examined based on the maritime industry reclassification shown in the Table 2. As of 2015, 1,063,451 employees are engaged in their jobs in 136,500 businesses. Gyeonggi province has the largest number of businesses with 24,218, followed by Busan Metropolitan City(13,299), and Gyeongsangnamdo(11,719). There are 10,785 maritime industries, including fisheries(5,5340), marine tourism(2,276) and shipping and logistics(1,078). The number of employees in the was 65,399, of which 23,120 employees are engaged in shipbuilding, 18,872 in fisheries, and 12,174 in shipping and logistics, respectively.
With respect to the division of maritime industry in Jeollanamdo province, the overall growth rate of the shipbuilding and fishery industries was high. This is attributed to the effect of shipbuilding business located in Mokpo and Yeongam areas in Jeollanamdo and the increase of marine products in Jeollanamdo where abalone, seaweed and laver aquaculture activities are active. In particular, the total number of maritime industry companies in Jeollanamdo province increased by 4.1%, and the number of employees increased by 4.2% for the past ten years from 2006 to 2015 in the Table 3 and Table 4. Especially the shipbuilding and marine tourism industries showed a rate of increase higher than the average increase rate. The shipbuilding industry includes the building of ships and the manufacture of shipbuilding equipment. In addition, fishing-related services showed a high increase rate, and the number of companies increased by 27.7%, and that of employees increased by 60.7% for the past ten years.

4.2 Analysis methodology
In this study, the location quotient and shift-share analysis were used. Through the location quotient analysis, the proportion of in Jeollanamdo province can be compared with that of the whole country to estimate the relative degree of specialization in Jeollanamdo province. If the value of the location quotient is greater than 1, the maritime industry is considered to be relatively specialized. The UK Department of Commerce(2001) judges that if the value is over 1.25, the industry is integrated within the region to form industrial clusters.
However, the location quotient has limitations in analyzing the competitiveness of industry, looking for growth industries or investigating the qualitative changes of the industry itself(Yu et al., 2010). Accordingly, the shift-share analysis was carried out to compensate for that shortcoming. The shift-share analysis is a technique for analyzing the growth factors of the base year and the comparison year of a specific industry in a certain area. This technique can be used to identify the growth and change factors of cities and regions and determine the locational appropriateness of the local industry. For example, a region with a large proportion of industries that show rapid growth throughout the country grows faster than other regions. Also, there is a limitation in explaining the inter-industry linkage, and it is impossible to consider the industrial transition due to technology change. In this study, 2006, which is the beginning year of the 9th revision of the Korean Standard Industrial Classification, was set as the base year, and 2015 when the latest data were obtained was set as the comparison year.
For the total growth effect, the national growth effect (NGij), the industrial mix effect (IMij), and the regional share effect (RSij) were calculated by comparing the base year and the comparative year. And the equations are (2), (3) and (4). The total effect (TE) is sum of the national growth effect, the industrial mix effect and the regional share effect, and the net effect (NE) is the sum of the industrial mix effect and the regional share effect (Mo, 2017).
4.3 Analysis results
The location quotient analysis results of Jeollanamdo province are summarized in the Appendix. The location quotient was the highest in other industries with 2.7902, followed by fisheries(2.2273), shipbuilding(1.1635), marine tourism(0.5542), and shipping and logistics(0.5010), respectively. In other words, it can be said that in Jeollanamdo province, highly integrated industry clusters are being formed in fisheries. The detailed industry-specific analysis is listed in the Appendix.
Appendix : Result of LQ and Shift-share analysis for maritime industry of Jeollanamdo
As confirmed by the number of businesses and the number of employees, Jeollanamdo province showed growth in shipbuilding and marine tourism. The location quotient manufacture of other generators and electrical converters, and the manufacture of electric lighting equipment for general use in 2006, but the location quotient dropped sharply in 2015.
In the fisheries, the integration of aquaculture, fishing-related services, aquatic animal dried and salted product manufacturing, and aquatic plant processing and storage was made as th location quotient was greater than 1.25. In the marine tourism, the integration of fishing place operation, recreation condominium operation and domestic travel business was made in 2006, but the integration was low in 2015.
The shift-share analysis results of Jeollanamdo province are shown in the Appendix. The total grow effect was 26,363, and the net growth effect, except for the national growth effect, was estimated to be 7,551. In the case of shipping and logistics, the net growth effect was 6,371, and the general warehousing recorded the highest growth with 1,876. Other industries that show the net growth of more than 500 were air freight and land freight handling, and industrial truck and product handling equipment manufacturing. The total growth effect of the shipbuilding industry was 11,970, whereas the net growth effect was 6,926. In particular, the net growth effect of 4,836 was observed in the manufacture of sections for ships. The total growth effect in fisheries was 2,848, of which the wholesale business of aquatic products was the highest with 2,529. The net growth effect was -3,811, showing no shift-share effect by fisheries in Jeollanamdo province. The marine tourism showed the total growth effect of 2,852, and the net growth effect of 1,529. Among them, the net growth effect of more than 300 was observed in the operation of other tourist accommodation facilities and recreation condominium operation.
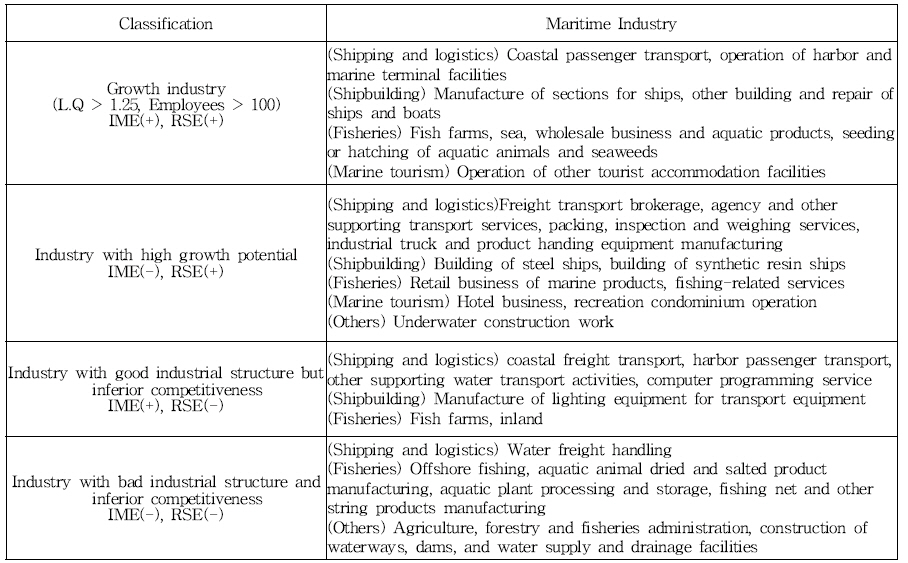
In the shift-share analysis, if the industrial mix effect, the regional share effect and the new growth effect of the region are divided into positive(+) and negative(-) factors, respectively, the four types of industries appear. In this study, the industry sectors were classified into growth industry, industry with high growth potential, industry with good industrial structure but inferior competitiveness, and industry with poor industrial structure and inferior competitiveness. In Table 5, the growth industry shows industries in Jeollanamdo province, which have the location quotient of greater than 1.25 and more than 100 employees in consideration of the total growth effect and the net growth effect. Also, Both IME(industrial mix effect) and RSE(regional share effect) showed the sign of the positive value. Freight transport brokerage, building of steel ships and so on, which have negative values for IME and positive values for RSE, are classified as industries with high growth potential. As results of IME and RSE, we categorized industry structure and competitiveness with other regions.
5. Conclusion
The national and municipal governments have promoted the formation of maritime industry clusters to increase added value and induce the integration through the clusters as the range of the port areas expands. The structural analysis of maritime industry in Jeollanamdo showed that the locational integration of fisheries, shipbuilding and other industries has been made, and Jeollanamdo province was found to have the advantage over other regions in terms of the growth effect.
Since Jeollanamdo province is located in a clean sea area in fisheries, the marine aquaculture has developed, and the integration of wholesale business has been made in the distribution process of maritime products. However, despite the abundant infrastructure of offshore fishing, aquatic plant processing and storage, and aquatic animal frozen product manufacturing, Joellanamdo province showed low integration and inferior industrial structure to that of other regions. In the case of shipbuilding industry, the integration has been made in the building of synthetic resin ships, the building of non-ferrous metal sips and other sailing ships, and the manufacture of sections for ships. The marine tourism industry also exhibited low integration in general. On the other hand, the operation of other tourist accommodation facilities showed high growth potential. However, since general and overseas travel business was inferior to that of other regions in terms of industrial structure, there is a need to devise policies for the activation of marine tourism industry.
Therefore, Jeollanamdo is expected to focus more on intensive investment and industrial revitalization in shipbuilding and fisheries, which are more integrated than other regions. In particular, aggressive measures are needed for industries based on the manufacturing, processing and storage of seafood for creating added value beyond the simple wholesale business for the distribution of marine products in fisheries. Even in the marine tourism, the integration of general and overseas travel business needs to be performed using marine tourism resources.
Furthermore, in Jeollanamdo, the introduction of clusters in industries with high locational superiority and growth effects needs to be examined from a long-term perspective. Especially, it is necessary to establish the relationship with the urban planning of the background area to achieve a synergy effect when clusters are formed around ports located in Jeollanamdo. In addition, institutional improvements should be made to establish policies for resolving side effects caused by the regional self-centeredness, and to designate region-specific maritime industries as clusters.
 PDF Links
 PubReader
 Full text via DOI
 Download Citation
 Print
Print


