

Introduction
In Southern Asia, Sri Lanka has bypassed his neighbors. Colombo accommodates large container ships that are deployed on services between Asia and Europe, as well as some services to Africa and South America. Feedering from Colombo to ports in India can be done with ships under any flags, as these services are not affected by the Indian cabotage restrictions (UNCTAD 2017).
Colombo noticeably became the most economical gateway to the Indian subcontinent in both cost and time wise. Many alliances and many new services showed their interest to call Colombo emphasizing the immediate need of capacity and capability building. Colombo Port Expansion Project (CPEP) started commencement with the purpose of accommodating mega ships under the long term strategies of making Colombo the hub of South Asia.
In this context, the aim of this study is to investigate the causal relationship between Indian portsŌĆÖ originated container traffic and total transshipments of port of Colombo and also to identify the nature of the causality between the two variables, evaluating the Granger causality test results. The findings would be helpful for future forecasting of container traffic in Colombo port and policy making process in the port as well.
1.1 Port of Colombo: an overview
Growing ship sizes open up the opportunity for Colombo port to develop as the maritime hub of south Asia. Colombo has just 4 hours deviation from the main route, where the nearest next port in the Indian subcontinent has a deviation of 12 hours. With this inherent advantage, Colombo has already become a preferred shipping destination.
Containerization started in south Asia with Queen Elizabeth Container Terminal at Port of Colombo on 1st of August in 1980. But the internal conflict started in middle of 1980s pushed Sri Lanka back from development. When the war is over in 2010, Colombo had 3 container terminals, Jaya Container Terminal(JCT), Unity Container Terminal(UCT) and South Asia Gateway Container Terminal(SAGT).
The new breakwater at Colombo port is about 6 km from length and it has a depth of 18 meters compared to the previous 14-15 meters, a crucial difference in a world in which ever bigger cargo ships require ever deeper berths. The construction of breakwater was completed in 2012. The first container terminal of new Colombo South Port is completed in July 2013 and this made possible for Colombo port to accommodate the latest generation container ships which carry 18,000TEU and more. The completion of Colombo South Port Expansion Project will eventually increase the capacity of Colombo by 12.5 million TEUs per year. In April 2014 South Container Terminal which is named as Colombo International Container terminal (CICT) was fully completed and commenced its operations.
Colombo continued to record throughput growth following the opening of a third terminal, the only deepwater terminal in Southern Asia capable of handling ships with a capacity of 18,000 TEUs and above (UNCTAD, 2017).
Port of Colombo has been ranked among the worldŌĆÖs best 25 ports accordance with the LloydŌĆÖs rankings in 2017. According to the categorization, in 2016 Port of Colombo has been ranked for the 23rd place moving three places up in this list relative to the ranking in the 2015. In 2016, the annual growth was 10.5% from 5.2 million TEUs to 5.7 million TEUs recording as its rank as 25th(LloydŌĆÖs list, 2017).
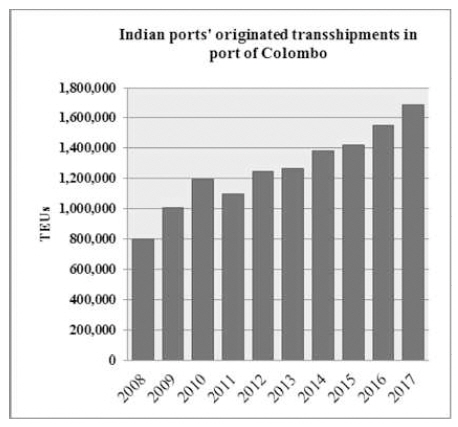
Colombo port is mainly a transshipment hub with 76% of throughput coming from transshipment as past records of container traffic. In 2014 container transshipments were grown up by 15% and the growth in 2015, 2016 and 2017 respectively about 5%, 12% and 9% (see the Fig.1).

Sri Lanka ports authority is currently looking to grow itsŌĆÖ container handling volumes by developing East Container Terminal under the South port expansion project. According to the Asian Development Bank, which supported the port upgrade project with a $ 300 million loan, made a bold projection that Colombo port will handle 10 million TEUs by 2020.
Ultra large container carriers and very large container carriers, many of a size that only the Colombo South Terminal (CICT) is capable of handling, had contributed 70% to the volumes it achieved in 2016. CICT is the first and currently the only deepwater terminal in South Asia equipped with facilities to handle the largest vessel afloat.
This paper is divided into four sections and in Section 2; we present a review of previous related works. Section 3 describes the Research Methodology and empirical results and section 4 provides the conclusions.
1.2 South Indian portsŌĆÖ originated container traffic in port of Colombo: an overview
The transshipment container volumes over the port of Colombo are almost totally depend on volumes coming in/out of South Indian sub continent, mostly India, Bangladesh, Pakistan and Male Islands (see Fig.2).

In the global shipping market too, the transshipment of cargo has a major role to play and it will continue to be so in the foreseeable future. Due to the increase in ship size & capacity the cost of calling many ports in the same region is not a cost effective exercise to a shipping line.
Most of the Indian ports as they stand now are unable to accommodate the Ultra- large container carriers that are now being introduced to the main haul service this is mainly due to the restricted depth and other infrastructure and labor related issue which are perennial in nature. The geographical locations of some Indian ports may not ideally fit into the shipping lineŌĆÖs requirement of minimum deviation and Colombo will continue to fit into the shipping lines equation.
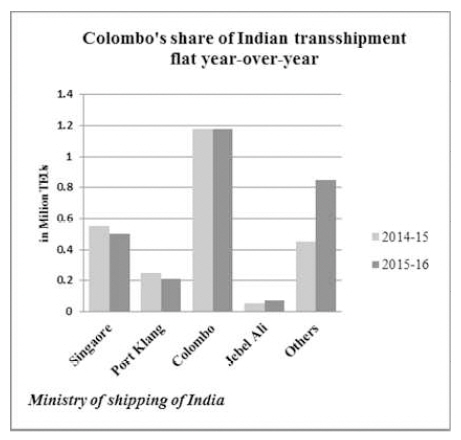
IndiaŌĆÖs extant major ports do not have such deep drafts, so quarter of all containers are transshipped through ports of other countries. Colombo (Sri Lanka), Singapore and Klang (Malaysia) handle more than 80% of IndiaŌĆÖs transshipment cargo; of them, Colombo alone handles about 43% (Nidhi Jamwal, 2017).
Statistics show in 2015- 2016 volume of transshipped containers moving through Colombo for IndiaŌĆÖs major, or public, ports stayed flat with the prior year at 1.9million TEUs. Colombo had the largest share of the Indian transshipment throughput in last year accounting for 42%, while Singapore with the second largest gateway for Indian transshipments with 17% share followed by Port Kelang Malaysia at 8% (see Fig.3) (Indian demand for Colombo transshipment, 2016).
Literature review
The contribution of Granger(1969) regarding statistical causality was one of the main starting points for the empirical analysis to find the direction of causality between two variables. In the field of public finance, the majority of the Granger causality tests have been conducted in two directions. The first one is on the relationship between economic growth and government expenditures. The other one is the relationship between government expenditures and national income (Park, 1998). Fig.4
Mihai Mutascu(2016) surveyed ŌĆ£Government revenues and expenditures in the East European Economies: A Bootstrp panel Granger Causality ApproachŌĆØ and found that a unidirectional causality from public expenditures to revenues in Bulgaria. For the Czech Republic, Hungary, and Slovenia, government revenues explain expenditures, and a two-way causality exists for the Slovak Republic and no Granger causality is found for Estonia, Lithuania, Poland, and Romania. Fig.6
Fig.┬Ā6
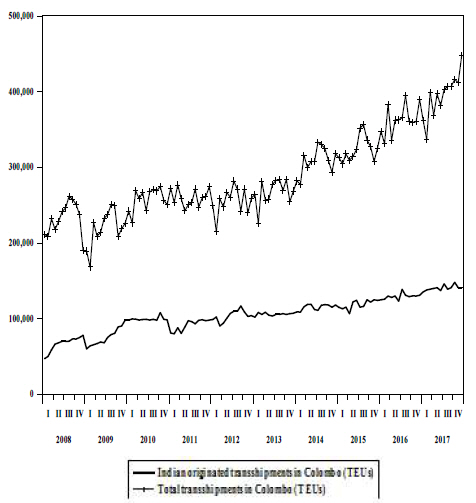
Indian portsŌĆÖ originated transshipments and total 1`transshipments in port of Colombo monthly data from 2008 to 2017
Park(1998) also investigated the Granger causal relationship between government revenues and expenditures in Korea over the period of 1964 to 1992 using time series data and found that there was a unidirectional causal relationship from government revenues to expenditures.
A number of causality studies can be found in investigating about the transportation sector as well as in shipping and port related matters during the past years. Elton Fernandes & Ricardo Rodrigues Pacheco(2010) surveyed ŌĆ£The casual relationship between GDP and Domestic air passenger traffic in BrazilŌĆØ and explored that there is a unidirectional Granger causal relationship from economic growth to domestic air transport demand in Brazil. The methodology followed time series causality analysis procedures and total domestic passengerkilometers are used as a proxy for air transport demand and gross domestic product (GDP) as a proxy for economic growth.
In shipping sector, Granger causality analysis was conducted by Amir H. Alizadeh & Nikos K.Nomikos(2003) in their survey of ŌĆ£The price-volume relationship in the sale and purchase market for dry bulk vesselsŌĆØ and causality tests between the two variables indicated that price changes Granger cause trading volume in the market for handysize and Panamax vessels as well as in the aggregate dry bulk price index.
In applying Granger causality test for ports sector, causality between port performance and traffic had been studied by Prabir De Buddhadeb Ghosh(2003) and surveyed ŌĆ£Causality between performance and traffic: an investigation with Indian portsŌĆØ. For this study, port performance index and port/transport statistics over 15 years of the 11 Indian ports were used as the data and applied Unit Root tests, Co integration tests and Granger causality tests in sequential manner to judge the nature and strength of this causality. The major finding of this study was port traffic does not course port performance but port performance does course port traffic in the ports of India.
Lili Song and Jianing Mi(2016) surveyed ŌĆ£Port infrastructure and regional economic growth in China: a Granger causality analysisŌĆØ. This article investigated the Granger causality between port investment and economic growth in China both at the full regional level and the sub-regional level. By applying the panel data for the period of 1999-2009, the error correlation model (ECM) is employed to test the Granger causality between port investment and economic growth. The results showed that short-term bidirectional causality exists between port investment and economic growth, and the long-term unidirectional causality exists between port investment and the economic growth.
An another Granger causality study related ports was conducted by Xin Tian, Liming Liu and Shouyang Wang(2015) to find the competing relationship between Shenzhen port and Hong Kong port in their research ŌĆ£ Evolving competition between Hong Kong and Shenzhen portsŌĆØ. This study used Container throughput monthly time series data of the two ports and conducted the Unit root test and the Granger causality test to determine the relationship between the two time series. The same methodology presented here was applied to understand of the port transport sector and analyze container traffic behavior in port of Colombo in this research as well.
Research Methodology and empirical results
3.1 Test of stationary and causality
Granger(1969) proposed a time-series data based approach in order to determine causality. In the Granger-sense X is a cause of Y if it is useful in forecasting Y. In this framework ŌĆ£usefulŌĆØ means that X is able to increase the accuracy of prediction of Y with respect to a forecast, considering only past values of Y.
Regression on non stationary time series directly may lead to a misleading conclusion, that is, it may show an apparently significant relationship between uncorrelated variables. The quality of the causality test is also sensitive to the stationary of the time series. Thus, we first need to determine whether the data series are stationary using the unit root test. For non stationary time series, we then test whether they are co-integrated. If the time series are neither stationary nor co-integrated, we then determine the relationship between the two time series. If the two time series are stationary or co-integrated, we then determine their Granger causality relationship using the Granger test (Granger, 1969), and compute the long-run relationship coefficient by using the ADL model or co-integrating equation .The relationship between the two variables can be determined by the Granger causality relationship and long-run relationship coefficient.
3.2 The Unit root test
When considering the unit root test, we first use the Augmented Dickey-Fuller (ADF) test (Said and Dickey, 1984) to determine whether the data should be differentiated to render stationary data. The ADF test here consists of estimating the following regression:
where ╬ö is the first deference operator, t is the time trend, k denotes the number of lags used, and čöt is the error term. ╬▒i╬┤ and ╬▒i are parameters. The null hypothesis that series Yt is non- stationary can be rejected it ╬┤ is statistically significant with negative sign. In addition, m shows the optimal lag order, which is chosen carefully using the Akaike information criterion (Akaike 1973) and Schwarz information criterion (Schwarz 1978).
3.3 Granger causality test
Granger(1969) proposed a test for the direction of causality, and this was commonly used as a convenient and general approach by later researches to detect the presence of a causal relationship between two variables, using time series data. The definition of causality between two series, given by Granger(1969), is entirely in terms of predictability. Essentially, X is said to cause Y if a prediction of Y on the basis of itsŌĆÖ previous history can be improved by taking in to account past values of X. It is also possible for causation to proceed in the reverse direction, given the validity of a symmetric statement. That is, reverse causality or feedback from Y to X can be said to exist if X can be predicted better by taking account of past values of Y than by not using them. Therefore, the causal relationship between X and Y can be bidirectional, if the causation is found to run in both directions simultaneously (Lili Song & Jianing Mi, 2016).
The Granger causality test is applied in this study to explore the causality between Indian originated container traffic and total transshipments of Colombo with using monthly time series data from 2009 to 2017. Causality tests assuming that both variables are stationary are performed using the following Vector Autoregressive (VAR) model,
In terms of this model, total transshipments of Colombo Granger causes Indian portsŌĆÖ originated transshipments if the coefficients ╬▓1,i for i = 1,2, ŌĆ” p in the first equation are jointly significant, i.e. the null hypothesis of ╬▓1,t = 0 for i = 1, 2, ŌĆ” p is rejected. Similarly, Indian portsŌĆÖ originated transshipments Granger cause Colombo transshipments if the null hypothesis of ŌłØ2,i for i = 1, 2, ŌĆ” p is rejected.
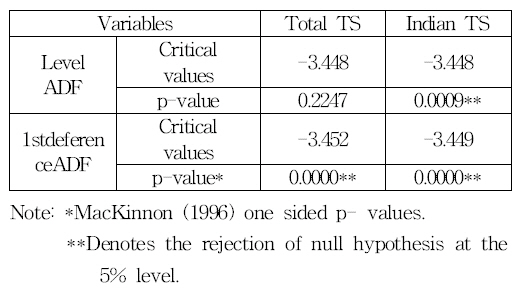
Only stationary series are involved in terms of the definition of Granger causality (Granger, 1969).To check whether the variables used in this study are stationary, we run the augment Dickey-Fuller (ADF) test on the Indian portsŌĆÖ originated transshipments and total transshipments in port of Colombo as a first step. As the empirical findings show, when the ADF test is applied on the original value of both variables, the results indicate that the null hypothesis of a unit root cannot be rejected at the 5% level; however, the null hypothesis of non-stationary can be rejected for the first difference of each of the two variables at a 5% level of significance (see Table 1).
The optimal lag length is important to identify the true dynamics of the model. VAR system is used to determine the optimal lag length. We employed the popular criteria to choose the optimal lag order and the results shown in the Table 2.

From the Table 2 it is clear that lag order 3 is the optimal lag according to sequential modified LR test statistic, FPE, AIC and HQ information criterion. Hence, we accept the judgment of the four criteria which indicates optimal lag order of 3.
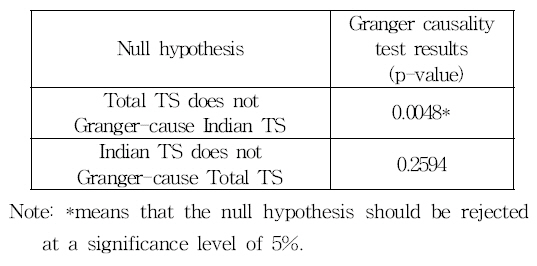
Table 3 reports the results for the Granger causality tests on the Indian PortsŌĆÖ TS between Total TS in the port of Colombo. The empirical findings show that there is a unidirectional Granger causality from Total TS to Indian TS in the port of Colombo but there seems not to be any causality from Indian TS to Total TS.
Conclusions
Granger pointed out that if co-integration exists in a pair of series, there must be causation in at least one direction. The study investigates the relationship between Indian portsŌĆÖ originated transshipments and total transshipments in the port of Colombo and to identify any possible direction of causality between them. The result of the study shows that total transshipments in the port of Colombo has much to contribute to Indian portsŌĆÖ originated transshipment traffic via the port of Colombo.
Furthermore, this sends an important message to policymakers to carry out the Colombo port expansion project and other proposed development plans in order to attract much more strong transshipment volumes from the Indian subcontinent region specially, India, Bangladesh, Pakistan and Male Islands. With increased use of larger vessels in the South Asia transshipments markets, development of additional deep water berths are urgently needed in the port of Colombo as the only port in the South Asia region with a deep water terminal that can accommodate the latest generation of mega ships. Under the circumstances, the developments of East Container Terminal of Phase 1 and 2 under the Colombo port expansion project will be a great advantage to attract a large share of the container transshipment traffic originated from India as the fastest growing, largest economy of the South Asia. The findings of this paper contribute to understanding the important role of Colombo port in South East Asia and needs for future port development project. In the future research it is necessary to identify the reasons for the growth of transshipment cargo volumes and suggest policy implications.
 PDF Links
 PubReader
 Full text via DOI
 Download Citation
 Print
Print


