

Introduction
Evolution of logistics management during past several decades has been critical to the healthy growth of the South Korean economy. Since the economy of the export-powerhouse heavily depends on international trade approximately 85%, provision of cost-efficient and clock-working logistics service is of particular importance in order to maintain the competitiveness of its export and import companies. In this regard, researchers in this area have paid heavy attention to functional or strategical aspects of logistics, such as supply chain management, operational optimisation and cost reduction.
While a growing number of logistics companies get listed on major stock exchanges around the world to raise funds, financial management of logistics firms becomes a particular concern for both corporate managers and investors. For instance, investors require a logistics company to adopt more transparent corporate governance which is quite different from what it used to be (usually privately-held) in order to monitor managerial activity and, as a consequence, to reduce agency problem. From the perspective of equity investors, another major aspect of financial management of logistics companies is return on investment. Since equity investment is regarded, in general, as riskier than others (e.g. government bond and bank savings), investors require higher return on equity investment as compensation for bearing risk.
From the perspective of corporate managers in logistics companies, investors' return means the cost of raising equity. Given that the success of a business depends on increase in firm value from investment, determining the cost of capital is a major task of managers. It is for the reason that managers should incorporate the degree of uncertainty embedded in an investment project and this is usually done by using a cost of capital. The most popular method of the cost of capital calculation is the weighted average of cost of capital, weighted by the proportion of each funding source (McLaney et al. 2004). While the cost of debt is easily calculated (e.g. bank interest rate), determining the cost of equity is a challenging task since it is largely associated with unobservable investors' expectation.
Among a plethora of solutions to the challenging task, one of the most frequently used methods is CAPM, independently developed by Sharpe (1964) and Lintner (1965). According to CAPM, the expected return on an equity is linearly dependent on that on the whole stock market. The slope coefficient in the linear relationship, which is called 'beta', measures the sensitivity of an individual stock to the whole equity market movements (or systematic risk). If beta is greater than one, it indicates that the stock is more volatile than the whole stock market. Vice versa, if beta is less than one, it indicates that the stock is less volatile than the whole market.
Since previous empirical evidence suggests that beta is affected by industry-specific factors (King, 1966; Arditti, 1967), there have been several attempt to examine the market sensitivity of stocks of logistics companies either on a global or a country basis. However, with exceptions of Lee and Park (2010) and Baek and Park (2016), evidence on stock prices and their sensitivity to market-wide shocks in the Korean logistics industry is relatively scarce. Accordingly, this paper investigates betas of Korean logistics companies. Especially, this study focuses on time-varying properties in sensitivity of logistics equities and macroeconomic determinants of betas. The empirical analysis is based on 21 logistics companies listed on Korea Exchange for the period January 2001 to October 2016.
The remainder of this study is structured as following: Section 2 reviews theories on time-varying beta and previous literature on betas of logistics companies; Section 3 discusses methodological framework and describes data; Section 4 presents empirical results; and Section 5 concludes.
Theoretical Background and Literature Review
Since the seminal work of Sharpe (1964) and Lintner (1965), there have been a variety of research work to support the asset pricing model in both theoretical and empirical aspects. A strand of literature finds that beta of an equity is not constant, but time-varying (Gomes et al., 2003; Lewellen and Nagel, 2006). The time-varying property of beta is largely associated with several factors. First, both macro- and micro-economic factors can affect the degree of systematic risks of stocks (Bos and Newbold, 1984). Second, beta of a company varies according to economic or market conditions. It is generally assumed that beta increases in bearish markets while decreases in bullish market (Drobetz et al. 2016). Third, beta can be industry-specific. King (1966) suggests that stock prices are time-varying according to market-, industry- and company-specific factors. Moreover, it is found that industrial factors account for a large fraction of changes in stock prices (Arditti, 1967)
Given the findings in previous literature indicating that the industry with high cyclicality and operating/financial leverage has a high degree of sensitivity to systematic risk, it is reasonable to predict that beta of the logistics industry is higher than market unity. Contrary to the theoretical prediction, most previous studies on beta in the logistics and related industries have found that it is less volatile than the whole market. In addition, they offer contradicting findings on time-varying characteristics of logistics beta and the impact of macroeconomic and microeconomic factors.
Kavussanos and Marcoulis (1997) find that beta of shipping companies in the USA is lower than one, but the difference is not statistically significant. While beta of shipping stocks does not change over time, its change is related to market conditions. Drobetz et al. (2003) and Lampe and Hofmann (2014) investigate beta of shipping companies and logistics service provider, respectively, on a global basis and find betas are lower than market unity. On the other hand, Lee and Jang (2007) find that average beta of US airliners is higher than one. Similarly, Drobetz et al. (2016) report higher betas among international shipping companies. Regarding to the time-varying property of logistics beta, Gong et al. (2006) find that beta of transportation companies in the USA varies according to different estimation methods and different periods. Drobetz (2016) also report higher betas of stocks of shipping companies on a global basis. Tezuka et al. (2012) find that the beta of the Japanese liner industry is largely influenced by regulatory changes.
Research on beta of Korea logistics and related companies is very thin. Lee and Park (2010) report that beta of ship investment companies in Korea is less volatile than the whole market. Baek and Park (2016) suggest that ship investment can be an alternative for National Pension Fund since it exhibit less risky risk-return profile than others when the counter-cyclical investment is carried out. Despite the previous attempts to investigate risk-return profile of the logistics industry, there have been no study covering all logistics companies listed on Korea Exchange.
Methodology and Data Description
3.1. Methodology
Beta of an equity is calculated by dividing covariance between the excess return of equity and the excess market return by variance of the excess market return. Mathematically, the relationship can be expressed as:
where Rjt is the expected return of stock j at time t, Rft is the risk-free rate at time t, ╬▓i is the beta of stock j and Rmt is the expected return of the market portfolio at time t.
However, one of the problems in Eq. (1) is that it assumes the risk-free rate as constant. If the risk-free rate is time-varying and correlated with market return, the coefficient of beta is subject to bias. To address this problem, financial researchers, in usual, employ the time-series regression model as following:
where rjt is the holding return of stock j at time t, Rft is the risk-free rate at time t, ╬▓i is the beta of stock j, rmt is the holding period return of the market portfolio at time t and ejt is the non-systematic risk left unexplained.
In order to investigate the time-varying property of logistics beta, the sample period is divided into four sub-periods according to major economic events that had substantial impact on the Korean economy: (1) 1991-1997 (booming period), a period before Asian financial crisis; (2) 1998-2001 (recession), a period between Asian financial crisis and dotcom bubble; (3) 2002-2008 (booming period), a period before Sub-prime mortgage crisis; and (4) 2009-2016 (recession) a period of prolonged recession. Both average of individual equity beta and cross-sectional beta are estimated in each period. The mean difference between average of individual equity betas is examined during different period based on t-statistics. Cross-sectional beta is investigated with Wald coefficient test with the null hypothesis that beta equals one.
The impact of macroeconomic factors is modeled as:
where ╬▓jt is the estimated beta of stock j at the year t, Mt contains macroeconomic factors at the year t, ejt is residual.
3.2. Data
The empirical analysis is based the stock prices of 23 Korean logistics companies listed on Korea Exchange. Weekly stock prices are downloaded from Thomson Financial Datastream for the period of January 1991 to October 2016. To be included in the final sample, each equity should have at least 260 weekly observations which is equivalent to 5-year-long time-series. This criteria excludes 2 companies and leaves 21 companies for the analysis. In pooling the 21 logistics companies into the same basket, a major concern arises as the firms may involve heterogeneous business areas such as different modes of transportation (trucking, seaway, air or multi-modal). However, as the importance of global supply chain management is emphasised in order to satisfy needs diversified customers, the international logistics market becomes increasingly integrated and cooperation between logistics companies in different (business and geographical) areas has been observed very commonly. Accordingly, we consider that there is a great degree of association or interrelation between sample logistics firms.
KOSPI is the market-wide index used for the calculation of market returns. Continuously-compounded returns are calculated by taking first logarithmic difference of weekly stock prices. In usual cases, the finance literature employs the long-term coupon rate of government bond as a risk-free rate. However, as long-term bond of Korea is currently thinly-traded, it is sceptical to use the coupon rate as a risk-free rate. In addition, there is no consensus on the risk-free rate in the Korea financial market among researchers (Oh and Park, 2015). Accordingly, the Call rate, the overnight inter-bank interest rate announced by Bank of Korea, is used for the risk-free rate.
Table 1 provides summary statistics for weekly returns of stocks of Korean logistics companies and KOSPI. For the sake of analysis on the whole logistics industry, an equally-weighted portfolio consisting of 21 companies is constructed. As can be seen in the table, negative weekly returns are observable in the majority of logistics companies as well as in KOSPI. In addition, all individual stocks are either left- or right-skewed (negative or positive degree of skewness) and leptokurtic (degree of kurtosis higher than 3). Thus, the results of Jarque-Bera test indicate that null hypothesis of normality is rejected at 1% level for all returns. Despite the departure from normality, the results of the Augmented Dicky-Fuller (ADF) test indicate non-existence of unit root in time-series, which means that the dataset is appropriate for regression.
Table 1
Summary statistics for weekly returns.
| Code | Mean Std. | Dev. | Skewness | Kurtosis | Obs. | Jarque-Bera | ADF |
|---|---|---|---|---|---|---|---|
|
|
|||||||
| AMI | 0.0001 | 0.0824 | 0.8223 | 12.1510 | 1023 | 3684.77*** | -29.3138*** |
| ASA | -0.0010 | 0.0671 | 0.4669 | 7.8560 | 879 | 895.58*** | -30.5629*** |
| DBF | -0.0011 | 0.0910 | -0.0994 | 10.1087 | 1347 | 2838.40*** | -37.2308*** |
| GLE | 0.0006 | 0.0635 | -0.0123 | 7.4321 | 1347 | 1102.54*** | -37.6493*** |
| GLV | 0.0014 | 0.0636 | 0.0119 | 6.6842 | 565 | 319.55*** | -27.6846*** |
| HHB | 0.0006 | 0.0918 | 0.0655 | 7.6906 | 1347 | 1235.83*** | -35.8736*** |
| HJH | -0.0093 | 0.0752 | -0.4396 | 5.8465 | 356 | 131.66*** | -17.592*** |
| HJT | -0.0003 | 0.0784 | 0.0676 | 7.2367 | 1347 | 1008.45*** | -35.7135*** |
| HMA | -0.0029 | 0.0904 | 0.6677 | 6.4862 | 1099 | 638.20*** | -36.4868*** |
| ILL | -0.0060 | 0.1087 | 0.5498 | 7.0754 | 795 | 590.22*** | -28.8953*** |
| KAA | -0.0005 | 0.0703 | -0.1474 | 6.9652 | 1347 | 887.31*** | -37.9916*** |
| KAT | -0.0006 | 0.06080 | 0.5499 | 10.4523 | 1347 | 3184.90*** | -36.2961*** |
| KBT | -0.0006 | 0.0872 | 0.5379 | 12.7921 | 1347 | 5446.56*** | -37.8403*** |
| KLC | -0.0039 | 0.0977 | -0.4003 | 7.9548 | 1279 | 1342.49*** | -23.2212*** |
| KNM | 0.0009 | 0.0802 | 1.0609 | 19.5502 | 1347 | 15625.74*** | -28.3773*** |
| KRS | -0.0007 | 0.0792 | -0.9552 | 15.6473 | 1347 | 9182.30*** | -36.678*** |
| KSL | -0.0003 | 0.0498 | -0.8093 | 12.8262 | 470 | 1942.15*** | -20.1717*** |
| SHT | 0.0004 | 0.0957 | 0.3757 | 11.5187 | 1347 | 4104.61*** | -36.4277*** |
| SNK | 0.0004 | 0.0715 | -0.3986 | 11.6483 | 879 | 2762.57*** | -29.5472*** |
| SPO | -0.0109 | 0.1051 | -1.3471 | 14.6301 | 475 | 2820.64*** | -21.5745*** |
| YWC | -0.0004 | 0.1000 | 0.5955 | 8.1205 | 1347 | 1551.18*** | -35.8406*** |
| Portfolio | -0.0010 | 0.0467 | -0.8426 | 9.6281 | 1347 | 2625.10*** | -34.1732*** |
| KOSPI | -0.0004 | 0.0377 | -0.4550 | 7.8405 | 1347 | 1361.54*** | -39.3187*** |
Note: Full names of logistics companies are as following: AMI (Samil Transport), ASA (Asiana Airlines), DBF (Dongbang Transport Logistics), GLE (Sebang), GLV (Hyundai Glovis), HHB (Heung-A Shipping), HJH (Hanjin Shipping), HJT (Hanjin Transportation), HMA (Hyundai Merchant Marine), ILL (W Holding), KAA (Korean Air), KAT (Korea Airport Service), KBT (Kubko Trnaportation), KLC (Korea Line), KNM (KCTC), KRS (CJ Korea Express), KSL (KSS Line), SHT (Han Express), SNK (Sun Kwang), SPO (PanOcean), YWC (Hansol Logistics).
The macroeconomic dataset in the empirical analysis includes interest rate (overnight call rate), foreign exchange rate (Korean Won to 1 US dollar), inflation, domestic industrial production, oil price (spot Dubai crude oil 32 API quoted in US dollar) and the volume of international trade (the sum of export and import). All data are downloaded from Economic Statistics System, the Bank of Korea (see Panel A of Table 2).
Table 2
Descriptive statistics and correlation matrix for macroeconomic variables
Panel A:
Descriptive Statistics
Since the results of unit root test indicate all variables are non-stationary, the first logarithmic difference is taken to transform them into stationary. Correlation analysis indicates that most coefficients are sufficiently less than 80%, meaning that our results are to a large extent free from multicollinearity issue (see Panel B of Table 2). Although the correlation coefficients between (1) oil price and industrial production, (2) oil price and international trade and (3) international trade and (3) industrial production are close to 80%, the results of univariate panel data regressions show that those variables do not have significant impact on betas of logistics companies.
Empirical Results
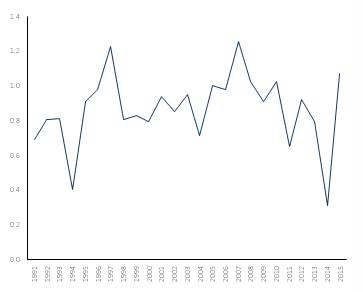
Fig. 1 depicts average betas of stocks of Korean logistics companies on an annual basis. It is obvious that betas of logistics stocks fluctuate from year to year. In addition, graphical illustration shows detectable trends in logistics betas.
In order to examine time-varying property of logistics beta according to economic conditions, average of annual betas are compared according to different economic regimes as defined in the previous section. Table 3 presents comparison of betas in different economic periods. Consistent with the findings in the previous literature on logistics beta, beta of stocks of Korean logistics firms is numerically lower than market unity and the difference is not significant at conventional levels. However, the degree of beta and its significance vary in different periods. Betas of Korean logistics companies tend to be higher under favourable market conditions, while lower under unfavourable periods. Specifically, during good economic regimes (1991-1997 and 2002-2008), the average of logistics betas is almost close to one (market unity). On the other hand, during bad economic states (1998-2001 and 2009-2016), it is between 0.85 and 0.86 and significantly lower than one. Mean difference tested by t-statistics between consecutive periods indicates significance at 10% level for all periods. However, the degree of beta according to different market conditions in this study is diametrically opposed to previous findings. It is generally regarded that beta tends to be higher during bearish market while lower during bullish market (Drobetz et al. 2016).
Table 3
Beta of logistics stocks by periods
| Whole Period | 1991-1997 | 1998-2001 | 2002-2008 | 2009-2016 | |
|---|---|---|---|---|---|
|
|
|||||
| Beta | 0.9560 | 1.0305 | 0.8556 | 0.9979 | 0.8596 |
| Difference | -0.1749* | 0.1423* | -0.1383* | ||
For more in-depth analysis, a portfolio comprising stocks of 21 logistics companies in the sample is constructed with equal weight of individual stocks. In addition, as explained in the previous section the cross-sectional panel regression is carried out. In order to test the null hypothesis beta equals market unity, Wald coefficient test based on t-statistics is also employed. Panel A and Panel B in Table 4 present the result of the two regression estimations, respectively.
Table 4
Beta of equally-weighted portfolio and cross-sectional analysis by periods
Panel A:
Equally-Weighted Portfolio
| Whole Period | 1991-1997 | 1998-2001 | 2002-2008 | 2009-2016 | |
|---|---|---|---|---|---|
|
|
|||||
| C | -0.0006(-0.7092) | 0.0002(0.1388) | -0.0018(-0.5316) | 0.0006(0.4223) | -0.0017(-1.6014) |
| Beta | 0.9078***(39.5140) | 0.9586***(20.5882) | 0.8396***(14.5742) | 0.9698***(24.3056) | 0.8523***(18.2373) |
| Adj. R2 | 0.5372 | 0.5394 | 0.5052 | 0.6188 | 0.4491 |
| Wald | -4.0145*** | -0.8888 | -2.7840*** | -0.7564 | -3.1611*** |
Panel B:
Cross-Sectional Analysis
| Whole Period | 1991-1997 | 1998-2001 | 2002-2008 | 2009-2016 | |
|---|---|---|---|---|---|
|
|
|||||
| C | -0.0008(-1.6349) | 0.0001(0.1164) | -0.0021(-1.0663) | 0.0008(-1.0663) | -0.0017**(-2.4546) |
| Beta | 0.9130***(66.0850) | 0.9738***(34.7837) | 0.8430***(25.2316) | 0.9893***(39.5539) | 0.8544***(27.4740) |
| Adj. R2 | 0.1599 | 0.2136 | 0.1685 | 0.1947 | 0.0788 |
| Wald | -6.2970*** | -0.9368 | -4.6978*** | -0.4294 | -4.6836*** |
The results of simple averaging analysis in Table 3 is robust in both portfolio and cross-sectional betas. Logistics beta tend to be higher during bullish markets while lower during bearish markets. Especially, the results of Wald test indicate beta of Korean logistics companies is slightly lower than one, but the difference is insignificant during 1991-1997 and 2002-2008. On the other hand, logistics beta is significantly lower than market unity during the whole periods, 1998-2001 and 2009-2016.
Finally, this study investigates the impact of macroeconomic factors on beta of logistics companies. Table 5 shows the results of panel data regressions. In E(1) to E(6), a single variable regression is run with Call rate, foreign exchange rate, inflation, industrial production, oil price and volume of international trade, respectively. E(7) is the results of multi-factor regression. It is revealed that foreign exchange rate is the only macroeconomic factor that affect beta of Korean logistics firms. As shown in the positive coefficient, it can be concluded that logistics beta is positively associated with increase in foreign exchange rate against US dollar. This is consistent with the findings in Lim and Lee (2014) and Yang et al. (2015) that the exchange rate of Korean won is significantly associated with the stock prices and profitability of Korean shipping companies. All other variables have no significant impact on logistics beta. Especially, evidence on oil prices is in a sharp contrast to the finding in Lee and Chang (2011) that fluctuations in oil prices exert a significant impact on profitability or profit/cost structure of a shipping firm.
Table 5
Impact of macroeconomic factors of logistics beta
| E(1) | E(2) | E(3) | E(4) | E(5) | E(6) | E(7) | |
|---|---|---|---|---|---|---|---|
|
|
|||||||
| Call | 0.0014(0.0120) | 0.1620 (0.9727) | |||||
| FX | 0.3251***(2.5939) | 0.3355***(2.6111) | |||||
| Inflation | -0.0330(-0.6983) | -0.0707(-1.2807) | |||||
| IP | 0.0522(0.1283) | 0.8459(1.0236) | |||||
| Oil | 0.0345(0.3426) | 0.1355(0.6973) | |||||
| Trade | -0.0914(-0.5099) | -0.6284(-1.4214) | |||||
Conclusions
This study investigates time-varying property of beta of Korean logistics companies and the impact of macroeconomic factors. The empirical analysis presents three major findings on logistics beta. First, consistent with findings in the previous literature on beta of transportation companies, it is found that equity beta of Korean logistics companies is significantly lower than market unity, which indicates that their stocks are less volatile in response to market movements. Second, beta of logistics companies is time-varying according to different market conditions. Logistics beta tends to increase during good economic states while decrease during unfavourable economic periods. Finally, it is revealed that logistics beta is positively related to foreign exchange rate.
Given that revenues in the logistics industry are largely volatile (most notably, freight rates for ship-owners and freight forwarders), the significantly lower beta of Korean logistics companies compared to market unity is quite conflicting with theoretical predictions and extant empirical evidence that the systematic risk level of a stock is positively associated with uncertainty in a firm's cash flows from business activity (Melicher, 1974). As previous literature on logistics betas point out, we also conclude that stock prices of Korean logistics firms should be analysed based on both systematic (market-wide) and non-systematic (industry-specific) risk factors.
The findings in this study offer important contributions for both academic researchers and industrial practitioners. This study is the first academic attempt to examine the sensitivity of stocks of Korean logistics companies to systematic risks affecting the whole stock market. For stock market investors, the unique risk-return profile of Korean logistics companies can provide a different class of financial assets when constructing well-diversified stock investment portfolios. For financial managers of logistics companies, recognition of sensitivity of their equities to market-wide systematic risks is crucial for determining the cost of capital which is a major building block in investment decision-making and raising external funding.
 PDF Links
 PubReader
 Full text via DOI
 Download Citation
 Print
Print


