

Introduction
Up to now, many researches and public reports have been conducted for that they recognize the importance of coastal shipping or the necessity to develop the industry, and suggest diversified policies to foster it.
For example, Maritime Affairs and Fisheries(2004) searched the status and found issues about the industry, and studied several industry competitiveness plans such as entering the market, fleet restructuring, supporting the financing and taxation system, and organizing the council between ship-owners and shippers through the working group meeting to suggest the governmental support measures of cabotage upbringing for domestic logistics innovation
Also, Korea Maritime Institute (2008a) proposed respectively three kinds of the coastal shipping promotion measures for ship-owners, shippers and both of them in order to construct the pro-environment logistics system. Thus, there are several studies to designate future directions toward developing the industry or to show somewhat specifically quantified findings. For all that, those plans are not still practiced properly, but rather, it is struggling for them to activate the coastal shipping. In fact, an empirical analysis has not been executed seriously how different policies for coastal shipping industry has an effect on the full-scale industrial competitiveness and macro economy.
Therefore, this study, by presenting a sort of the possible approach to analyze metrically the economic impact process of the development policies, is intended to confirm finally the potential of coastal shipping industry. This subject would be a major and urgent issue in practice of the industry as well as the review about it could show the basic rationale for breakthrough in the coastal shipping industry.
In addition, understanding of the complicated process, which fostering policy affects the cabotage, would help to recognize the magnitude of the industryŌĆÖs contribution, to assess the economic value for it, and to measure the future value of the industryŌĆÖs growth. The examination of this theme is expected to be timely in resolving the problems which the industry faces.
Theoretical Background
2.1 Fostering Policies on the Coastal Shipping
As mentioned above, there are some studies about fostering policy on the coastal shipping industry. According to these studies, it could be generally summarized by listing tax reduction, ship financing support, investment increasing of social overhead, and appropriate crew supply, and so on.
In the cabotage development policies that have been required for a long time, the key policy can be the taxation support such as the tax incentives and VAT free fuel oil supply. Especially, tax free program has not been applied to the heavy fuel oil actually used in the shipping, even though there is currently the one for diesel oil. The subsidy program for fuel oil has been preferentially required in the shipping practice. Compared with the case of land transportation, the subsidy is equally paid but seems a difference of more than 10 times in terms of tons/miles concepts.
Also, there are various support measures of government for ship financing, but do not currently have suitable alternatives to shipping companies with poor financial position because of the difficulty such as the capital composition, the high interest burden, and the additional collateral requirements of real estate.
Lack of cargo terminal facilities also need to be considered in a government policy perspective. One of the problems of coastal shipping is to take a long time to feed and transport the cargo, that is why it takes 3-5 times compared with other means of transport.
In addition, cabotage is suffering from a chronic shortage of sailors, and even aging of the crew is also very serious. Because these factors could threaten the safety of ship operation, it is well known that require adequate crew training and supply policies.
2.2 Topics of System Dynamics
System dynamics is an aspect of systems theory as a method to understand the dynamic behavior of complex systems. The basis of the method is the recognition that the structure of any system, the many circular, interlocking, sometimes time-delayed relationships among its components, is often just as important in determining its behavior as the individual components themselves. Because one of the features of the system dynamics is a methodology for estimating the future pattern changes by analyzing the changes in the system over the interrelationships between the variables, the advantage is in the point that it can analyze the dynamic aspect of the complex system with a non-linear feedback characteristic by using both quantitative and qualitative data.
So the system dynamics is used to solve a particular problem through analyzing simultaneously the changes of the variables in accordance with time flow and ones of the various parameter values associated with the problem.
Methodological phase of the system dynamics can be expressed as Fig. 1.

In order to analyze the economic effects of coastal shipping industry fostering policies, it has to consider preferentially the complex relationships of a number of factors, and cannot but depending on the system dynamics approach encompassing the feedback relationships between variables in particular.
In other words, when it applies system dynamics analysis to verify the feasibility of the policies because of the complexity of the process, it could be expected to ascertain the effectiveness of the policies. System dynamics would allow to apply industrial characteristics with a number of uncertainties, qualitative aspects of development policies, and the various scenarios with variations.
System Dynamics Modeling can be diagrammed to an iterative process, as Fig. 2.
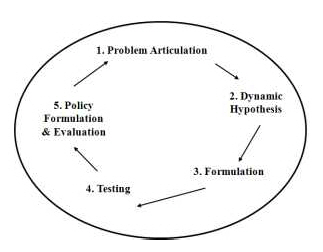
First, the problem is recognized and defined in the problem articulation step. Second, the variables within the system are selected and a dynamic relation among variables is defined in the dynamic hypothesis step. Third, based on the above steps, the modeling is run through stock-flow diagram, a simulation model configuration diagram of the relationships between the variables in the formulation step. Forth, the validity of the diagram is proved in the testing step. Finally, problem-solving ideas are presented in the policy formulation and evaluation phase.
Characteristics of the system dynamics analysis techniques can be divided into three.
Concretely, the procedure to illustrate the structural relationships within the system dynamics can be divided into causal loop diagram and stock-flow diagram. The causal loop diagram, what is called causal map, is composed of reinforcing loop and the balancing loop process as showing a causal relationship prior to simulation. However, CLD is just a tool which can help to easily understand the causality of the problem; it does not run directly a simulation for troubleshooting.
The stock-flow diagram largely consists of level variables and rate variables representing respectively stocks and flows as a simulation process for problem solving. Level variables indicate the volumes which of the figures are changed over time in the model, and rate variables, which change under the influence of other variables, means the variables that affect the level variable. The relation between level variables and rate variables is as follows:
Causal Loop Diagrams
3.1 Causal Loop Diagrams
System dynamics initially starting from engineering has mainly dealt with the hardware aspects that are based on the quantitative figure, however, one for the fields such as the policy development should not overlook the importance of the qualitative aspect as well as quantitative one. With the analysis of system dynamics for development and evaluation the public policies, the portion of its software side in which the analysis is more effective, is recently increasing trend. It is the causal loop diagram modeling that represents the soft methodology.
In order to create the CLD, a research has to excavate all affected factors to be considered as a whole, including configuration variables to identify the elements of model and their interrelationships.
Park(2016) built already a qualitative model through such a causal loop diagram as Fig. 3.
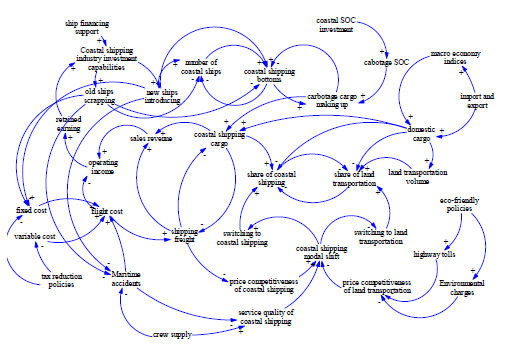
His study understands the dynamics of the coastal shipping industry as a feedback relation among cabotage cargo volume, share of transport, maritime service quality, and financing and investing capacity of firms within the industry, and so on. This dynamics would be similar to the one of general business.
For instance, enhancing the transport share of cabotage means the modal shift from land transport to coast shipping as the concept of customer acquisition. This shift is determined by the competitiveness of goods and service price and quality, that why it has a certain customer base similar to customer satisfaction. In addition, because the competitiveness of coastal shipping companies is governed by their financing and investing capabilities, the flight costs and ship investment would be important factors in the industry competitiveness.
It is the above CLD of coastal shipping industry that its dynamics is displayed through the similar path. However, in advance, this study defines the range of study by focusing on just one part of fostering policies, the taxation support, which Park(2016) proposed due to the limitations of research. The consideration of the other parts is probably kinds of future agenda.
3.2 Limitation of CLD
Although the causal loop diagram let easier understand the causality of problems, the diagram that itself is just a sort of qualified method. In order to approach quantitatively, introducing the concept of stock-flow diagram is required additionally based on the former diagram.
Kim(2000) said the fact that cognitive maps and abstract causal loop diagrams provide insight into the system, but they have a fundamental limitation not much to explain about the dynamic behavior of the system. For this purpose, the transition to a stock-flow diagram model is needed (Ministry of Science and Technology, 2005).
Specific system dynamics simulation is a kind of method overcoming the limitation of CLD as a way to reduce the intervention of subjective judgment about systemŌĆÖs elements as much as possible. Namely, system dynamics whose key content is to turn out the relations among elements of system can be divided into CLD to understand the causality and SFD(stock-flow diagram) to simulate it actually.
Specific system dynamics simulation is a kind of method overcoming the limitation of CLD as a way to reduce the intervention of subjective judgment about systemŌĆÖs elements as much as possible. Namely, system dynamics whose key content is to turn out the relations among elements of system can be divided into CLD to understand the causality and SFD(stock-flow diagram) to simulate it actually.
However, in the simulation modeling procedure to convert from causal maps to simulation model, there are the limitations that subjective judgement of researcher or policy maker cannot but be involved necessarily because in general the information of that conversion could not be specifically discovered.
Scenario Simulation
4.1 Tax Reduction Scenario
Until now, various polices have been proposed to foster coastal shipping, for example, tax reduction, ship financing, social overhead capital investment, crew supply, and so on. Even though most those plans are important and urgent in the cabotage practical issues, it could not be impossible but considerably difficult to analyze their effect at same time due to several limitations such as the lack of researcherŌĆÖs capacity, time shortage, and some other factors.
Therefore, this study once focuses on the taxation support only because the policy has been discussed for a long time and considered as the most effective and immediate incentive in accordance with previous field surveys (Park, et al., 2012). It generally includes tax free fuel supply and other tax reductions.
First, in the case of tax free fuel supply, the subsidy system for diesel exists currently, but the supporting of transportation tax is not be applied to the coastal shipping. Also, it is actually required to provide with the subsidy for bunker-C oil commonly used in the industry. In particular, though the subsidies of road and cabotage have the same structure, the subsidy per ton/km of coastal shipping shows the unfavorable difference of more than about 10 times comparing with one of land transportation. This situation of the discrepancy among industries means a kind of unfairness and inequity in implementation of governmental policy.
Next, in the case of other tax reduction schemes, the concrete support plan that the firms generally have required includes the full exemption of ship acquisition tax and registration tax(50% exemption, currently), the tax exemption about capital gains by purchase for replacement, the adoption of tonnage dues system which is being run in the ocean-going shipping industry, the application of tax support such as the crew payroll tax exemption up to 3 million won for ocean-going, and so on.
Absolutely, the realization of these tax incentives is necessary for overall public and social agreement of the policy making, but in fact, it is difficult to expect the effective and efficient improvements of business performance in the coastal shipping industry without these types of the revolutionary incentive approach.
This study is based on the logic that at first the taxation support has a positive effect on the operating income, net income and cash-flow of the cabotage enterprises, and the affirmative impact of those financial improvements could allow of dropping the freight rates and getting the competitiveness of price against road transport, and finally it would be able to create the new demand of cabotage cargo volume.
In other words, through the sequence of taxation support system, as follows: 1. improving profit and cash flow, 2. freight downside 3. reinforcing the price competitiveness 4. modal shifting, it would be expected to increase the transport share of coastal shipping.
4.2 Stock-Flow diagram
According to above logical structure, it is necessary for the simulation about how much coastal shipping freight can be down eventually by various taxation schemes including tax-free fuel supply and others, and expected shipping demand can be estimated within the relation of freight and cargo volume. The stock flow diagram indicating this dominant feed back loop is able to be illustrated as the following Fig. 4.

This structure requires a preposition that the freight of coastal shipping is determined to achieve the expected value of cargo demand and the definite target revenue of cabotage firms because it is similar to the typical price and demand model in the economic and business simulation.
4.3 Result of Simulation
In summary, the results of simulation in the expected shipping demand through the system dynamics modeling are demonstrated as Figure 5.
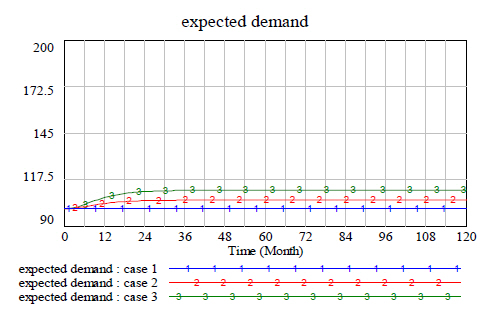
Initial shipping freight in terms of simulation basis was applied to 102.9(million won/ton) as 100% NUMBER. This figure is the average freight calculated by the sales revenue of the industry and cargo volume in the inner harbor over three-years (2011-2013).
In addition, this study simulated the model respectively configuring 0%, 5% and 10% as the level of maximum price down to be available through the taxation reduction policy. Namely, Case 1 means when the policy did not run, Case 2 is when the current shipping freight falls to 95% rates by 5% point figuring, and Case 3 to 90% by 10%.
So then, this simulation applied the reference shipping demand of 117.86 million ton in 2013 to 100% NUMBER. Table 1 shows the results of each case by the monthly demand forecast of cabotage cargo in the first year being calculated in terms of this reference demand.
Table┬Ā1
Monthly demand forecast of cabotage cargo in the first year (unit: million ton)
As can be seen in Table 1, assuming the available freight down by tax incentives to 5%, the shipping demand of cabotage cargo increased to 121,649 thousand ton, and also presuming to 10%, it was up to 125,751 thousand ton. Note the maximum volume of coastal shipping cargo recorded in the past was 122,205 thousand ton in 2008.
Changing the figures of Table 1 into the percentage to current volume of shipping cargo, the incremental rate of monthly demand forecast in the first year can be presented as the following Table 2.
Table┬Ā2
Incremental rate of monthly demand forecast in the first year (unit: %)
Table 2 explains that volume demand in Case 2 increase to 3.22%, and in Case 3 to 6.95%. For the effects of policy supporting continuously will be lasted during the subsequent years, they can be summarized as Table 3. It presents the annual demand forecast of cabotage cargo over ten years.
Table┬Ā3
Annual demand forecast of cabotage cargo over ten years (unit: million ton)
Table 3 appears the effect of the supporting, as can be seen in Case 2, on the expected shipping demand keeps increasing to 123,596 thousand ton in 2nd year, 123,989 in 3rd, and 124,052 in 4th. But, it is no longer increasing significantly after the fifth year. Similarly, in Case 3, 123,835 thousand ton in 2nd year, 130,792 in 3rd, and 130,932 in 4th, and the shipping demand is stagnant after the fifth year.
Furthermore, the shipping demands after 5th year does not increase any more is due to the reason why the freight down effect on the demand does not occur indefinitely. In the view point of micro-economic, although market price is determined by supply and demand, but the freight down is possible only till the level to achieve the clear target revenue of shipping companies. Thus, the freight as shipping price cannot be dropped to less than the cost of shipping, and then lower freight rates in maritime transport policy support levels are of flying cabotage it is now provided there is a limit.
In summary, one of the implications in this result is the fact that the effectŌĆÖs duration of taxation reduction policy on the increase in shipping demand would be approximately 4 years.
The following Table 4 represents the incremental rate of annual demand predicted over ten years to the current demand of cabotage cargo volume.
Table┬Ā4
Incremental rate of annual demand forecast over ten years (unit: %)
Table 4 is showing a conclusion that the demand volume for cabotage cargo could be increased up to 5.26%, if freight down is reduced by 95% point through taxation incentives, and also by 90% point up to 11.11%.
As this result gives a significant implication on the validity or reality of policy implementation, that is the findings which the level of available freight down at present must be lowered to 90Ōł╝95% points by the taxation reduction policy, in order to raise the current shipping demand volume of 117,860 thousand tons to the level over 120,000Ōł╝130,000.
Conclusion
Currently, there is a bleak prospect which the transport share of coastal shipping would fall to 11% despite the government goal to heighten it to 25% by 2020, if industrial reorganization is not executed through specific support policy for coastal shipping because the industry in general is faced with a lot of difficulties both internally and externally.
Many developed countries re-evaluate the coastal shipping as a desirable transportation for the formation of sustainable logistics system, and increase its role in the national logistics system, because it is well suited for the future traffic demand as low cost, high efficient, and environment friendly transportation system.
Park(2016) demonstrated empirically that the coastal shipping has the industrial competitiveness. However, in fact the governmentŌĆÖs policy support is desperately needed as well as competency reinforcement and business environment improvement efforts of coastal shipping companies, because the industry is still struggling. The agenda that government support is crucial for activation of cabotage is still valid.
As mentioned, it is very hard to evaluate quantitatively the feasibility of these governmentŌĆÖs support. Furthermore, this study is intended to search how the fostering policy of the government affects the coastal shipping industry as an opportunity for new growth of the industry. That is to say, the significance of the research is to propose how to quantify the effects of the support on industrial economy through a methodology of the system dynamics analysis. System dynamics is being perceived as presenting an optimized means to identify the dynamic relationships among the various factors of development policies and the industrial characteristics of coastal shipping with several uncertainties. Probably, the system dynamics approach attempted in this paper appears to be the first time in the studies about the coastal shipping industry.
To conclude, the simulation result of the study shows that the impact of the policy such as taxation reduction on the increase in shipping demand would be sustained during about 4 years, and that the taxation incentives policy could raise the demand volume for cabotage cargo up to 5.26Ōł╝ 11.11% through the available freight down reduced by 90Ōł╝ 95% points.
Simulation modeling is the process to collect data on the quantitative relationship on the basis of the qualitative model and to estimate the functions, variables and parameters within the relations, so then the result becomes just a quantitative model.
As already known, the quantitative model is comprised of level variables, rate variables, auxiliary variables and constants, where level variables indicate the stock of a particular variable, rate variables represent the instantaneous change in the stock, and auxiliary variables is ones necessary to calculate the others. These lots of variables could not be all considered in the model because of the various factors unquantifiable or unable to determine the relations among variables. This point would be also a limitation of this study, but a room for expansion. In other words, it can be seen that the future research direction is clear with respect to this research.
First of all, the industrial effects of another policy in this qualitative causal loop, for example, ship financing support, investment of social overhead, and crew supply could be analyzed respectively. Surely, it is also able to extend into a comprehensive model encompassing these analyses.
In addition, the simulation model presented in this study needs more precise estimates from the modeling process in order to obtain some realistic results because there may be a certain limit to the researchers in the estimation of different figures to be calculated.
And above all, it will be an assignment for researchers to increase the validity of the analysis result in the multi-dimensional point of view by considering the other potential variables which are not included in the simulation model, and then by iterating executions of the overall simulation encompassing those variables.
 PDF Links
 PubReader
 Full text via DOI
 Download Citation
 Print
Print


