

1. Introduction
Offshore wind towers have received focus as an alternative method to solve the problems of onshore wind farms such as securing sites, noise, and electromagnetic waves, and to obtain efficient wind energy. Therefore, many studies on the offshore wind energy have been carried out. Among these studies, Gaudiosi (1999) presented the research of offshore wind energy prospects in various European countries. In Japan, research on the predominance of offshore wind towers was carried out by Iguchi et al. (2000), and research on the development of medium and large scale wind towers in coastal zones was carried out by Nagai et al. (2008). In Korea, Kyoung et al. (2003) assessed the wind power resources along the Korean Peninsula.
The mono-pile support structure has been utilized as foundations for supporting the offshore wind tower at water depths of less than 30m. In this type of foundation, the soil conditions affect the bearing power of the offshore wind tower. The various soil conditions affect soil reactions and displacement.
In the offshore developments, various external forces such as wind force, tidal current, and impulsive breaking wave force act on the structure. Among these external forces, impulsive breaking wave force significantly impacts on the structure in a moment. Chun and Shim (1999) analyzed the dynamic behavior of a cylindrical pile subjected to impulsive breaking wave force. Especially, during a typhoon, the occurrence probability of a more powerful breaking wave is increased. Also, it is expected that the strength and occurrence frequency of typhoons coming to the Korean Peninsula will increase (Choi et al., 2009).
Andersen et al. (2012) presented the research of wind towers on the mono-pile foundations in clayey soils. The study on sandy soil is carried out by Jang et al. (2013). Also, Earlier research led by Kim and Go (2013) analyzed the soil reaction according to the external forces without impulsive breaking wave force. However, the studies on the relation between p-y curve in multi-layered soil and impulsive breaking wave force have rarely been carried out.
In this study, the p-y curve is used to calculate the soil reaction acting on the offshore wind tower when an impulsive breaking wave force and wind force act on the offshore wind tower.
2. Basic Equation
2.1 External Forces acting on the tower
It is important to analyze the impulsive breaking wave force acting on the offshore wind tower, for it is one of the most powerful forces.
The equation of the impulsive breaking wave force fz suggested by Tanimoto et al.(1986) is partially expanded as follows :
where ╬Ęb is the wave crest height, d is the water depth, ╬┤ is the width of distribution of impact force, 0.5╬Ęb. Žē0 is unit mass of sea water, D is the foundation diameter, and ╬Į is the adjustment factor, Hb is the impulsive breaking wave height (Goda, 1985). i is the sea bottom slope and L0 is the deep water wave length calculated by gT2/2ŽĆ. Also, A1 , A2, A3, and A4 are given to 0.8, 3.0, 0.45, and 1.0, respectively.
Wind force acting on the offshore wind tower is calculated by the Offshore Wind Power Generation Technical Manual (Coastal Development Institute of Technology, 2011).
2.2 Calculation of p-y Curve
In the analysis of piles supporting offshore wind tower, the key element in predicting the response to lateral loads is the determination of the appropriate lateral load- deformation relationships (p-y curves) for the soil. The pile analysis method commonly used in practice is the p-y method in sand proposed by Reese et al. (1974) and the p-y method in clay proposed by Matlock (1970), where the p-y curves represent the relationships between the lateral load (p) and the displacement (y) at a point in the pile (Pradhan, 2012). According to beam theory, shear force is obtained by integrating p and moment is obtained by integrating shear force.
2.2.1 p-y Curve in Sandy Soil
where k is the spring coefficient. This coefficient is obtained from Table 1. z and y are the depth of soil and the horizontal displacement of foundation, respectively.
Table┬Ā1
Recommended value of k (Reese et al., 1974)
| Relative density | Value(MN/m3) |
|---|---|
|
|
|
| Loose | 5.4 |
| Middle | 16.3 |
| Compacted | 33.9 |
Meanwhile, when displacement has sufficiently increased, the soil undergoes plastification, and then soil reaction does not increase. The ultimate soil reaction pu is presented by Eq.(3).
where Pc is the ultimate soil resistance. In the vicinity of soil, Pc is calculated as follows :
And at some deep point, Pc is calculated as follows :
where Au is an empirical correction factor. The factor is applied from Table 3. b in Table 2. is 0.6m. ╬│ is the unit weight of soil, ŽĢ is the internal friction angle of sand, K0 is 0.4, KA is tan2(45o - ŽĢ/2), ╬▒ is ŽĢ/2, and ╬▓ is 45o + ŽĢ/2.
Table┬Ā2
Values of empirical correction factor Au (Reese et al., 1974)
Table┬Ā3
The condition of cohesive soil (Andersen et al., 2012)
| cohesive soil | |
|---|---|
|
|
|
| embedded depth | 35m |
| undrained shear strength | 150KN/m2 |
| submerged unit weight | 12KN/m3 |
2.2.2 p-y Curve in Cohesive Soil
The p-y curve in cohesive soil is based on method suggested by Matlock (1970). In this method, the ultimate soil strength per unit length is calculated using Eq. (6) as follows :
where cu is the undrained shear strength, J is an empirical dimensionless parameter (=0.5). The displacement at 50% of the ultimate soil resistance is determined as follows :
where Ōłł50 is the strain corresponding to 50% of the maximum principal stress difference in the soil.
Next, the soil resistance at rest Prest is calculated as follows :
where xr is coefficient according to the depth z. Finally the soil resistance can be determined as follows :
where y is the absolute value of the foundation displacement. If the pile displacement is negative, the sign of p needs to be changed.
In this study, spring coefficient of the p-y curve is simplified as follows :
where yc is the displacement of foundation, which occurs at 50% of the ultimate soil resistance.
3. Verifications
In order to perform verification, two soil condition cases are considered. The first case is compared with the same cohesive soil conducted by Andersen et al. (2012) and the second case is compared with the same sandy soil conducted by Jang et al. (2013). Table 3 and Table 4. show the condition of cohesive soil and the condition of sandy soil, respectively.
Table┬Ā4
The condition of sandy soil (Jang et al., 2013)
| sandy soil | |
|---|---|
|
|
|
| embedded depth | 60m |
| k | 16.3MN/m3 |
| internal friction angle | 36┬░ |
| unit weight | 20kN/m3 |
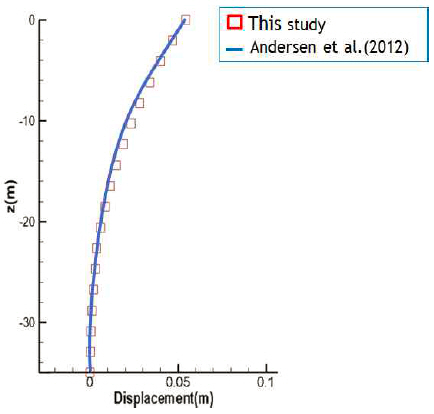
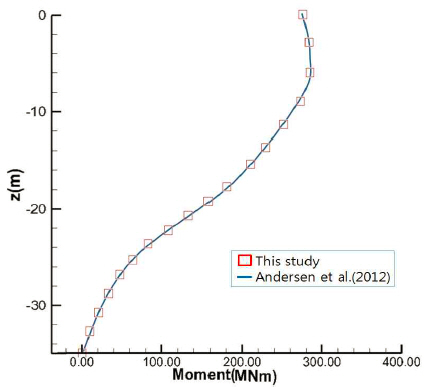
In the case of cohesive soil, the height of the offshore wind tower is 100m. The wave force and the wind force are 2MN and 1MN, respectively. Figs. 1 and 2 show a comparison with the results obtained by Andersen et al. (2012). The comparison results show a good agreement between this study and Andersen et al.ŌĆÖs (2012) result.
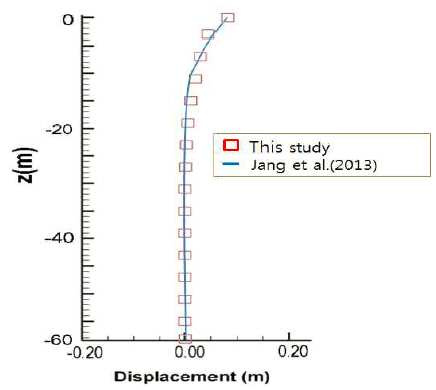
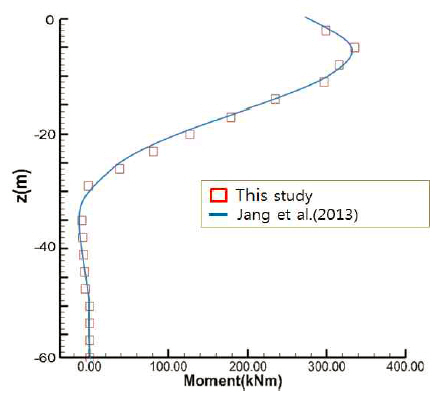
In the case of sandy soil, the height of the tower is 90m. Figs. 3 and 4 show a comparison with the results obtained by Jang et al. (2013) comparing with various soil modeling methods. The comparison also shows good agreement between this study and Jang et al.ŌĆÖs (2013) result.
4. Computation of the Impulsive Breaking Wave Force
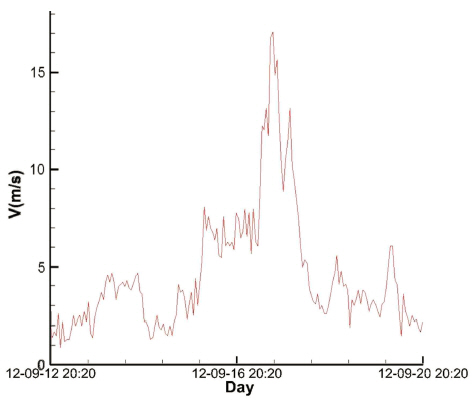
In this study, the water depth, wind speed, wave period, and wave height observed from 12 Sept. 2012 to 20 Sept. 2012 in Gujwa are used (Leading Industry of Jeju Economic Region, 2012). The water depth is 16m. Fig. 5 shows the observed wind speed. When typhoon SANBA crossed Jeju island, the maximum wind speed was 17.7m/s.
Figs. 6 and 7 show the observed wave period and observed wave height, respectively. The maximum wave period and wave height are 8.94s and 6.2m, respectively. It is shown that the wave period and wave height increase according to the approach of the typhoon.
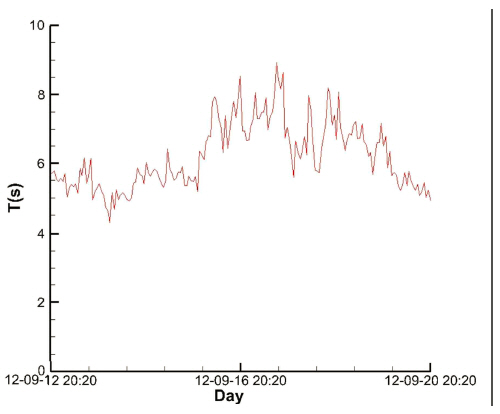
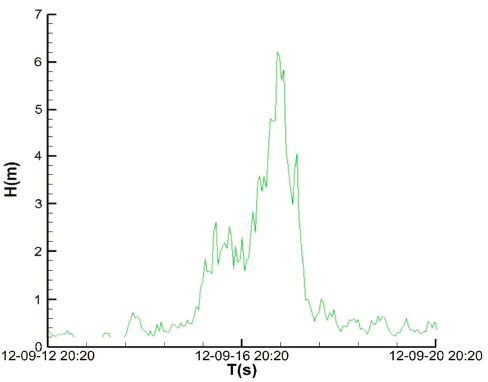
Fig. 8 shows the comparison between impulsive breaking wave force and wave force of linear wave driven by MorisonŌĆÖs equation. The analysis result shows that breaking wave occurs when the wave height is higher than 4.7m by Tanimoto et al. (1986). Before the breaking wave occur, both wave forces present the same value.
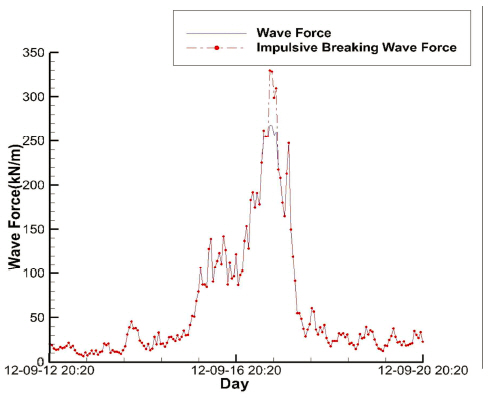
After the occurrence of the breaking wave, the maximum values of impulsive breaking wave force (320kN ) and wave force (212kN ) present significantly difference.
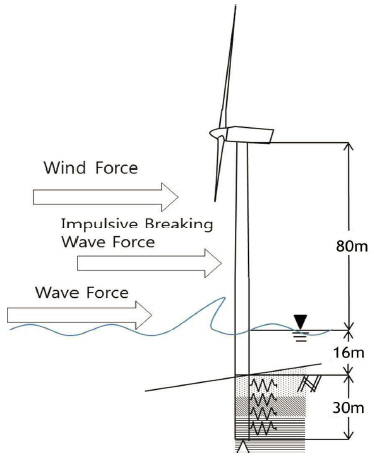
5. Analysis Results
Fig. 9 shows the conditions for the offshore wind tower. The top diameter, bottom diameter and the height of offshore wind tower are 3.87m, 6m and 80m, respectively. The water depth and embedded depth are 16m and 30m. The impulsive breaking wave force is 320kN from Fig. 8. The generator is 5MW NREL. The mono-pile is STK 490 steel pipe, which is the same condition with Jang et al. (2013). The elastic modulus is 210,000MPa, and unit weight is 77 kN/m3.
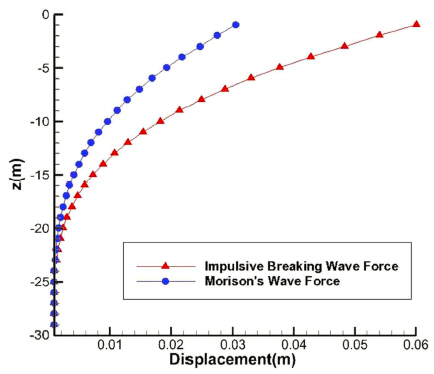
The seabed ground is composed of three layer, of which the depths of the soil layer are 11m, 10m and 9m, respectively. At the middle layer, the soil condition is cohesive soil from Andersen et al. (2012), which is in Table 3. At the top layer, the soil condition is sandy soil, which is the same condition with Kim and Park (2005). The internal friction angles and unit weight are 30o and 15.7kN/m3 , respectively. k is 10.8MN/m3 . At the last layer, the soil condition is sandy soil from Jang et al. (2013), which is in Table 4. Figs. 10~15 show the results of this study. Fig. 10 shows the displacements by impulsive breaking wave force and wave force. The maximum displacements are 0.0375m and 0.06m, respectively. Fig. 11 shows the soil reactions by maximum impulsive breaking wave force and wave force. The maximum soil reactions are 5MN/m for the maximum wave force and 6MN/m for the maximum impulsive breaking wave force. It is considered that distinction of soil reaction is occurred according to the distinction between impulsive breaking wave force and wave force.

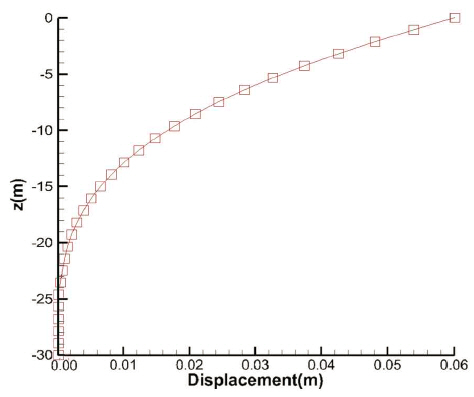
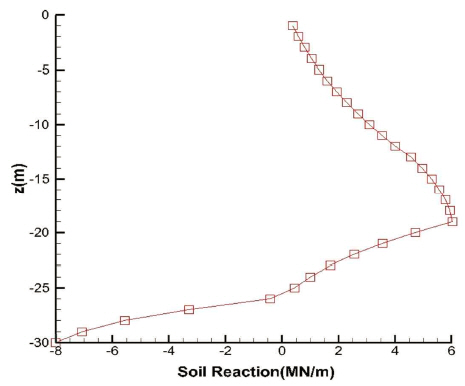
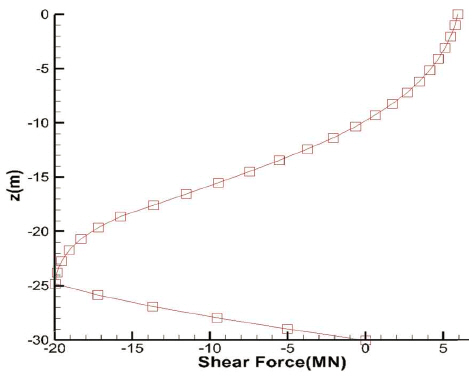
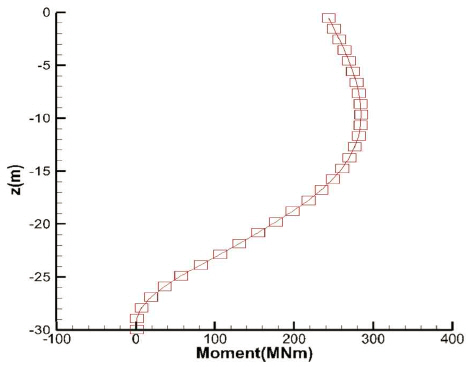
Figs. 12, 13, 14, and 15 show the displacement, the soil reaction, the shear force and the moment by impulsive breaking wave force, respectively. The maximum displacement is 0.06m, and occurs at the mono-pile cap. The maximum soil reaction and the minimum soil reaction occur in the middle of the foundation and at the mono-pile cap, respectively. It is shown that not only soil strength but also confining pressure according to the embedded depth affect the soil reaction. The maximum shear force is presented at 25m and has a value of -20MN . The maximum moment is presented at 11m and has a value of 281MNm.
6. Conclusions and Remarks
This study is carried out to investigate the soil reaction acting on the mono-pile foundation supporting offshore wind tower due to the impulsive breaking wave force during the typhoon SANBA.
The results obtained in this study show that although the same wave height is applied, the soil reaction by impulsive breaking wave force is greater than wave force. The maximum displacement presents at the mono-pile cap, and more displacement presents in the case of impulsive breaking wave force. The minimum soil reaction occurs at the seabed surface, the maximum soil reaction occurs in the middle layer of seabed ground. These results are caused by the confining pressure, which becomes lager with increasing in depth of soil ground.
There are various manuals such as ICE 61400-3 and DNV on impulsive breaking wave force. However, these manuals have recommended the application of impulsive breaking wave force in general breaker zone. Typhoons result in higher wave height, and it can contribute to generate breaker zone into the open sea. However, the application on particular cases like in various breaker zone by typhoon has been inadequate. Therefore, in the Korean Peninsula, where typhoons have often hit, it is considered that the effect of impulsive breaking wave force in various breaker zone moved by typhoon should be carried out for the design of the offshore wind tower.
 PDF Links
 PubReader
 Full text via DOI
 Download Citation
 Print
Print


