

1. Introduction
Electronic Chart Display and Information System (ECDIS) is a ship-borne navigational system. Integrating a variety of information, ECDIS continuously provides the navigators with accurate and reliable information to determine a ship’s position in relation to charted navigational features such as land, navigational aids and unseen hazards. Within the ECDIS, the ENC database stores the chart information in the form of geographic objects represented by points, lines and area shapes, carrying individual attributes, which make any of these objects unique(Bartlett, 2016). To conduct a sea voyage safely and efficiently, a mariner must have a well-founded understanding of the operating environment. This is especially true for navigation in ice waters. It is the responsibility of all mariners to ensure that before entering ice-covered waters, adequate ice information is available to support the voyage from beginning to end. ENCs are limited available for polar coastal navigation and normally created using the same information available on traditional charts and may not guarantee enough information for safe navigation(IHO, 2012).
To assist marine navigation, many ice-affected nations have government-run ice charting agencies to produce and distribute the ice charts of their regional waters to use side by side with ECDIS to supply more adequate and comprehensive information of ice for safe and efficient navigation to mariners. Unfortunately, they would not overcome the problem that it is too difficult for mariners to make a safe route. For instance, an ice-free route in ice charts may be coped with hazards such as wrecks, obstructions or narrow waters that make this route unsuitable(El-Rabbany, 2004).
In current phase, ice information has been integrated into the ENCs. The International Hydrographic Organization (IHO) has developed an S-411 Product Specification in response to a requirement to produce an ice data product that can be used within ECDIS(IHO, 2014). It makes it possible for ships engaged in navigation process to plan efficiently and safely their manoeuvers with respect to hazardous ice conditions.
In recent years, the Northern Sea Route (NSR) has attracted significant attention due to global warming from Korean government and researchers. It is predicted to improve marine access in the future with the investment of navigation technology. Unfortunately, because of the large challenge in navigation and uncertain ice conditions, the risks involved in navigating the NSR seem extremely high. For safe operation through NSR, navigators must have knowledge of ice. Generally, it is necessary to distinguish the distribution of ice, age (thickness) and size(Kim, 2015). Although S-411 has been adopted by IHO, ice objects for ENC were merely introduced(O, 2016) but their advantage was not examined in any system or simulation to display in ECDIS.
Therefore, the goal of this article is to review the status of ice objects in present official Specifications for ECDIS. Then simulation with real ice data is carried out to verify the effectiveness of standardized colors and symbols for the ice objects influence the visualization of ECDIS compared to the traditional layout. After analyzing benefit and some existing issues, suggestions are made to improve the display of ice objects in ECDIS. In order to do this, open source Geographic Information System (GIS) is adopted to read and display ice data. According to their prior and important attributes, ice objects have their own appearances on ECDIS screen with designated colors and symbols. Observation of clear appearance of ice objects greatly assists the mariners to generally determine the ship’s encounter situation, evaluate the ice status of sea area, and then plan a good passage route to so as to avoid risks of collision with icebergs in ice-covered waters. Nevertheless, some improvements should be made to bring more accurate information to mariners.
2. Literature review on ice object in ECDIS
The IHO has two special publications for electronic chart data classification, namely the IHO S-57 data standards [IHO 2000] and the IHO S-52 specifications for chart contents and display [IHO 1998]. Unfortunately, such standards are lacking for ice information, representing a major challenge for the Ice/ECDIS integration. Section 2.1.2 of S-52 points out that one of the challenges presented by versatility of ECDIS is to display ice information and this specification does not describe how to display it either(IHO, 1998).
Some attempts to convert ice coverage information into an IHO S-57 format to use in conjuction with ENCs in ECDIS have been made(Diarbakerly, 2002; El-Rabbany, 2004; Dias, 2006). Although the testing performed showed that the results were correct and accurate, it was impractical and not implemented in any Performance Standards for ECDIS.
Marine Information Overlays Ice Coverage - Portrayal contains information on the size, shape and colour of symbols to be used for ice objects which are declared in The Object Catalogue based on IHO S-57, Edition 3.1.1 in conjunction with S-52.
Unlike S-57, S-100 is inherently more flexible and makes provision for such things as the use of imagery and gridded data types, enhanced metadata and multiple encoding formats. It also provides a more flexible and dynamic maintenance regime via a dedicated on-line registry.
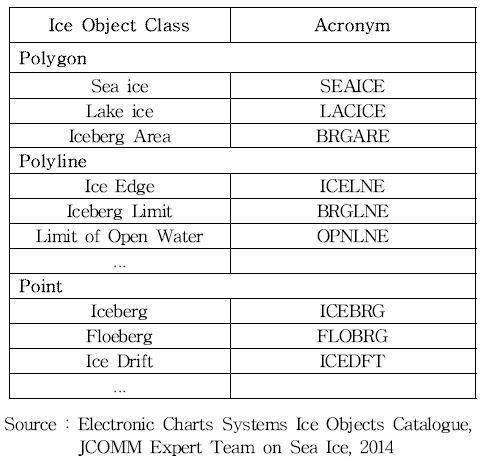
ENC and ECDIS are becoming widely available on ships navigating in icy waters and it is necessary to provide ice data in a form that can be used in these systems. The ENC Ice Objects Catalogue is a standard ice content for ENC, contains a description of ice objects. There are three classes of geometry: Polygon, Line and Point. The ice information product includes 28 feature types with their attributes: 3 types of Polygon Objects, 9 types of Line object and 16 types of Point object(JCOMM, 2014). In comparison with MIO Ice Coverage - The Object Catalogue, this catalogue contains more objects. Table 1 shows a part of list of objects in three classes of ice objects.
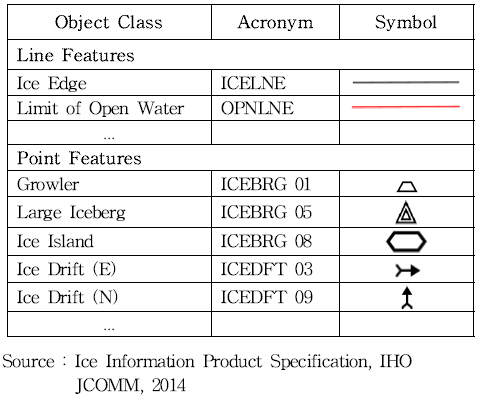
Each object comprehends attributes which carry the description characteristics of the object. Within the S-100 family, Ice objects have been denoted in S-411. The application schema of ice information product contains feature types with their attributes, enumerations, is based on the Ice Objects Catalogue and can be found in the ICE domain of the IHO Registry(JCOMM, 2014). In this Specification, two attibutes Total Concentration (ICEACT) and Stage of Development (ICESOD) are selected to represent Ice Polygon object. ICEACT specifies the total concentration of ice in an area and represents the ratio expressed in tenths describing the total area of the water surface covered by ice as a fraction of the whole area while ICESOD describes the ages and thicknesses of the ice. Based on the value of attribute, the Ice Polygon object can be displayed on ECDIS screen with specified color as can be seen in Table 2 and 3. These colors were adopted by the WMO. Different with Ice Polygon object, Ice Line and Point objects are represented by symbols. The object’s attribute that will be used to determine how the object is displayed, and the description of the attribute that is to be used. The proposed symbols are defined in Table 4.


3. Simulation of Ice objects with standardized colors and symbols in ECDIS
The aim of this section is to represent the Ice Objects by their own chosen attribute with the standardized colors and symbols above.
ECDIS is basically an information system that has a spatial attribute. Therefore, it is one kind of Geographical Information Systems (GIS)(Diarbakerly, 2006). The S-411 is fully based on the IHO S-100 framework specification, Geography Markup Language (GML) Encoding Standard and the ISO 19100 series of standards. For the encoding of ice datasets GML 3.2.1 was used. The dataset and support files are combined in a Exchange Set, which is shown in Figure 1.

S100 is a root directory of Exchange Set. Data/ is subdirectory of S100 containing dataset. *.gml is dataset file in GML. Support/ is subdirectory of S100 containing support files. CATALOG.ICE Metadata file for whole Exchange Set.
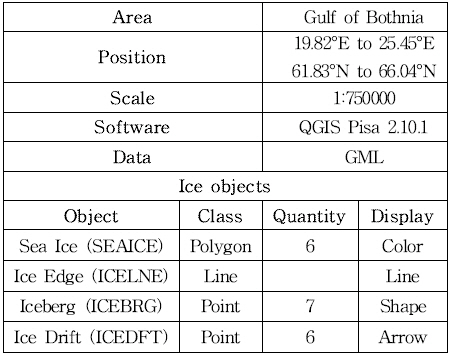
In order to illustrate the effectiveness of the standardized color and symbols for Ice objects in ECDIS, simulation was carried out in Gulf of Bothnia, the northernmost arm of the Baltic Sea. It is situated between Finland's west coast and Sweden's east coast (19.82°E to 25.45°E, 61.83°N to 66.04°N). The ice data is originally collected , then structured and symbolized primarily with cartographic display. This data is issued weekly in during the ice season in the Baltic.
To present ice data, an open source GIS software, namely QGIS Pisa version 2.10.1 was used. The original ice data digital file was imported into QGIS in order to be easily viewed and sorted. As introduced above, each class of Ice objects contains many feature types. Among them, Sea Ice, Iceberg and Ice Drift are the most common is that which results from the freezing of the sea surface. One kind of polygon object, i.e. Sea Ice (SEAICE) and two kinds of point objects i.e. Iceberg (ICEBRG) and Ice Drift (ICEDFT) are shown in this simulation. Sea Ice is an area at sea that is covered, in whole or in part, with ice. Sea Ice occurs in a wide range of types and forms, and affects significantly and directly marine transport and navigation. An Iceberg is a massive piece of ice, and an Ice Drift is for motion of an ice field or floe as a result of forces such as wind and currents.
The scale for chart was 1:750000. It is general chart represented large oceanic basins and is used for study of the navigation conditions and preparing for the sea passage.
The results of simulation are shown in Figure 2, 3 and 4. While Figure 2 is showing the ice-infested area without any color or symbol for Ice objects in ECDIS, Figure 3 and 4 are showing the same area with defined Ice objects’ appearances.

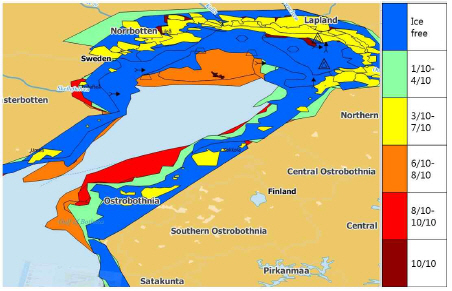

Figure 2 illustrates an example of ice-covered sea area in ECDIS, presented by QGIS but without any color or symbol. All Ice objects are displayed with white color. SEAICE objects should be recognized by their characteristics such as total concentration or stage of development, ICEBRG objects significantly vary in shape and ICEDFT objects are defined by their motion.
However, in traditional layout of ECDIS, it is nearly impossible to distinguish what level of Sea Ice objects and what kind of Ice Point objects with their characteristics. To minimize the risks of a collision with floating ice, it is important to make a distinguishable appearance for the ice. This will make the mariners possible to make the right decisions in time.
When applying the standardized symbols and colors, the appearance of Ice objects in ECDIS are showing greatly different. Total Concentration (ICEACT atrribute) and Stage of Development (ICESOD atrribute) are representative for Ice Polygon objects in Figure 3 and 4, respectively. In both cases, symbols for Ice Points objects also are utilized. ICEACT is useful variable for mariners. Total Concentration is the determining factor in defining ice boundaries. Ice Edge (ICELNE) objects’ appearances in this simulation are just black line to show the boundaries between polygon objects. Each color is representative for different level of ice concentration and easy to distinguish. Travel through ice-covered area can be reduced by using colors of SEAICE objects via ICEACT to avoid areas of high concentrations of ice. Through the colors, mariners can quickly access the detail about ice concentration distribution and plan safe clearance off areas known to have significant concentrations of ice (such as orange, red or dark brown areas). One problem should be mentioned here is that the range of ice concentration for one color is too long and overlapped. For example, if a sea ice area has 4/10 ice, both green and yellow can be representative for this level. The same issue is with 7/10 ice. It could lead to inaccuracy during evaluation process of mariners.
Different with ICEACT, ICESOD atrribute comprises different subtypes of ice forms which change depending on time and environmental conditions. Stage of Development attribute relates to thickness and age of ice. Mariners can evaluate ice conditions (new ice, young ice or old ice, etc..) before entering the ice. For an unstrengthened ship, or for a ship whose structural capability does not match the prevailing ice conditions, it is preferable and safer to take any alternative ice free route than going through ice.
As we can see clearly, both ICEACT and ICESOD are useful and effective to display characteristics of Ice Polygon objects but only one attribute can be used on the screen. The selection of attribute is not mentioned in any Specfication of IHO.
In Figure 3 and 4, two kinds of Ice Point objects are displayed.: Iceberg (ICEBRG) and Ice Drift (ICEDFT). While the former is represented by shapes to indicate their sizes, the latter is represented by arrows to indicate their motion. Icebergs are extremely hard and can cause considerable damage to a ship in a collision. Smaller pieces of icebergs, for example growlers, are especially dangerous to ships because they are extremely difficult to detect. These growlers can be seen in ECDIS screen by trapezoid symbol. Large icebergs and ice islands also are clearly displayed by triangle and hexagon shape, respectively. The arrows in two figures show the direction of the movement of the ICEDFT objects (heading North and East). However, same as Iceberg, Ice Drift is categorized by its dimension but present symbols (arrows) could not supply this information to mariners. These shapes and symbols should carry important information about ice to mariners.
4. Suggestions and Discussion
Although ECDIS screen becomes more and more distinguishable due to the detectability of ice objects with the help of colors and symbols, there are still some issues that should be overcome.
1) Standard for display mode of Ice Polygon objects
Among these subsets of attributes, one attribute should be used to determine how the object is displayed on ECDIS screen in consideration of which information of each object needed to show to mariners. In some cases certain attributes may be designated as priority. There are some reasons why an attribute may be considered to be priority: - Some attributes are necessary, as they determine whether an object is in the display base.
Ice Polygon objects are displayed in ECDIS via two attributes ICEACT (Total Concentration) and ICESOD (Stage of Development). In “Ice Chart Color Code Standard“ of WMO, there are two separate color codes with options for use on sea-ice charts as follows:
However, the S-411 “Ice Information Product Specification” still did not have any guideline or standard about which attribute should be use in priority. The two colour codes are mutually exclusive; only one should be used on a single screen.
2) Detail colors for Ice Total Concentration
The range of one color to display Total Concentration may be too long. For instance, to demonstrate “1/10 ice” and “3/10 to 4/10 ice”, only green color (140 255 160) is applied. The similar one is that yellow (255 255 000) is applied for “3/10 to 5/10 ice” and “6/10 to 7/10 ice” as well. Another is that these ranges are overlapped (at 4/10 ice and 7/10 ice). These problems may lead to mariners’ confusion when evaluating the situation. It is better to have more colors for each level of Ice concentration.
3) Colors for moving ice objects
Moving ice objects now are only presented by arrow symbols to show their direction. However, Ice Drift consists of ice floes which are classified by size. Therefore, Ice Drift objects should carry additional information about size to mariners. Their symbols may be used along with colors to depict the dimension of moving ice. If these objects was displayed by arrow direction, combined with color, mariners can detect direction as well as size of moving ice objects at the same time.
5. Conclusion
The aims of this paper are to review the present standards to display of ice objects on ECDIS in Specification S-411 of IHO, then carry out the simulation to investigate how and to what extend the way of displaying ice objects in ECDIS screen with defined colors and symbols in comparison with traditional layout. After analyzing some existing advantages and problems, some suggestions have been given to enhance the appearance of ice objects in ECDIS. They assist better the mariners to detect ice objects with their own characteristics in the short time and assess the ice conditions that the ship is likely to encounter. However, standard for displaying mode of Ice Polygon objects and more colors to carry more information for Ice objects should be applied. The ultimate purpose is the safer and more efficient navigation practices. All efforts should be made to obtain detailed information on ice conditions. With these improvements in ECDIS, mariners will be benefited by being able to plot safer courses via NSR and the Polar Regions.
 PDF Links
 PubReader
 Full text via DOI
 Download Citation
 Print
Print


