

Introduction
Marine accidents, undesired abnormal events of a ship that often result in loss of life or major injury to any person on board and in various types of property damage, have been a major issue in the international maritime community since shipping began (Luo and Shin, 2016). Usually the marine accidents are not caused by only a specific factors, but are caused by a combination of various causes.
Investigation into the causes of shipping accidents show that over 30% of the accidents are caused by poor weather(Faulkner, 2004). And as reported by Korean Maritime Safety Tribunal, about 17% of the operation errors of grounding, capsizing and sinking happened between 2013 and 2017 were caused by severe marine weather and readiness mishaps.
The marine weather information which provides for vessels is mainly offered by radio device such as NAVTEX, Weather Fax., and others. However, the information is too general for the wide area and lacks more detail. So many seafarers are disinclined to use the information to make a proper readiness of vessels safety avoiding some marine accidents such as grounding, hull and cargo damage, and cannot make an optimal and economical navigation plan considering this kind of low precision weather information.
In recent years, a number of new wind speeds forecasting methods have been proposed. The physical models are usually based on the NWP(Numerical Weather Prediction) models, which provide the wind speed forecasting by using the mathematical models of the weather and topological data like pressure, humidity, temperature and wind direction(Pelik├Īn et al., 2010). Erdem(2011) built the traditional-linked ARMA models and vector ARMA models for wind speed forecasting. Cadenas(2007) presented the wind speed prediction models based on the ARIMA and artificial neural network methods. These models can obtain the wind speed forecasting by the linear or non-linear functions but often require many complex variables. Therefore it is sometimes very difficult to collect all the information mentioned above and put into practice.
The purpose of this paper is to develop a strong wind warning algorithm for the vessels anchored near coast or anchorage. This study has analyzed 10-minutes average wind speed data measured meteorological observatories near the water areas some grounding accidents happened in Korean ports, and developed the algorithm that could forecast the changing trend of strong wind a few hours before.
A significant benefit of applying this algorithm is that it can calculate the strong wind warning levels based on the wind speed data from the shipboard anemometer without some additional equipments. This algorithm will be very helpful in forecasting the coming strong wind and decreasing the probability of marine accidents.
Correlation analysis of strong winds and grounding accidents
Usually the poor weather and severe sea states have been considered as affecting factors on the likelihood of grounding, stranding, sinking accidents, etc. However, under changing weather conditions, the sea surface is too complex to predict, especially on a small time-scale(Kharif et al., 2009). Wind sea waves are directly produced by local growing winds, and when the waves spread without receiving further energy from wind, they gradually grow to a swell. So the wind sea waves and strong winds have been considered as one of the important affecting factors on the likelihood of grounding accidents. In this study, authors selected the 8 grounding accidents which occurred in Korean ports and coastal area from 2007 to 2016, and analyzed to identify any pattern or correlation between the time of the grounding accidents and the weather environment.
Table 1 shows the brief information on the cases including shipŌĆÖs name, accident time and places, maximum wind speed and atmospheric pressure in the range of 24 hours before and after the accidents. In this study, the wind speed data at one minute intervals, which are the basis of the algorithm development, were gathered from the web-site of Korea Meteorological Administration. The web-site provides 10-minutes average wind speed, and because the most foreign meteorological agencies use the 10-minute average wind speed to produce the weather information which is recommended by the World Meteorological Organization(10-minute average wind speed : measures ten minutes at a height of ten meters above the surface and takes an average). Therefore, 10-minutes average wind speed data are the fundamental resource for calculating the strong warning algorithm. And also, the wind speed data for each accident was collected from the nearest meteorological observatory to compare and analyze the accident occurrence and wind speed change patterns at that time.
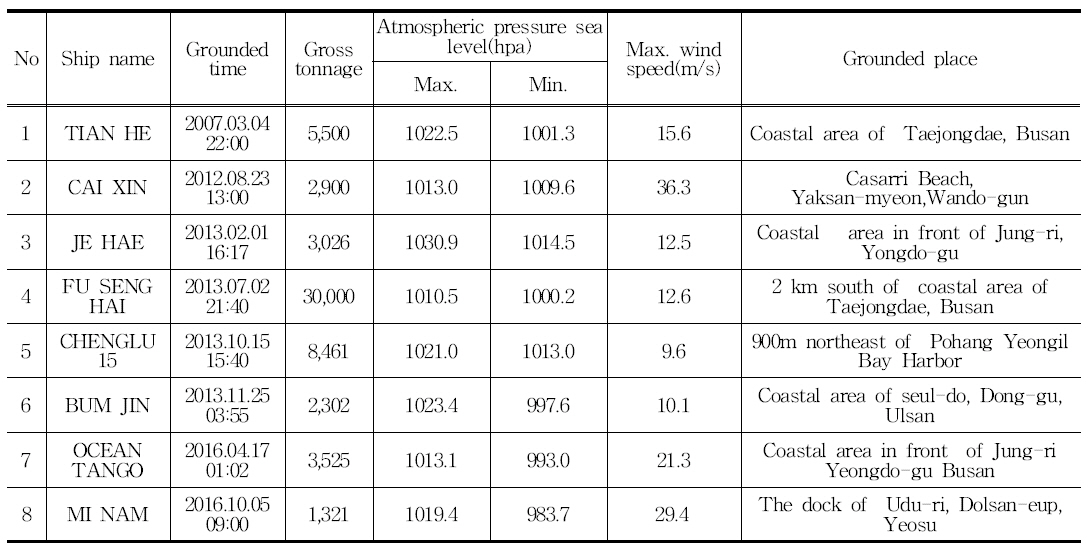
The maximum wind speed at the time of ŌĆśCAI XINŌĆÖ accident was 36.3m/s, but it was only 9.6m/s in the case of ŌĆśCHENGLU 15ŌĆÖ, so there can not be any meaningful relationship between the maximum wind speed and accident occurrence. Of course, the stronger the wind speed, the higher the likelihood of marine accidents such as stranding. However, this cases alone does not necessarily mean that the maximum wind speed and the possibility of accidents are linear. Therefore, authors analyzed the change of 10-minutes average wind speed at each accidents.
Fig. 1, Fig. 2 and Fig. 3 show the curve of 10-minute average wind speed during 48 hours when the grounding accidents happened in Table 1.
Fig.┬Ā1
48 hours wind speed curve of grounding accidents (ŌĆśTIAN HEŌĆÖ, ŌĆśFU SENG HAIŌĆÖ, ŌĆśCHENGLU 15ŌĆÖ)
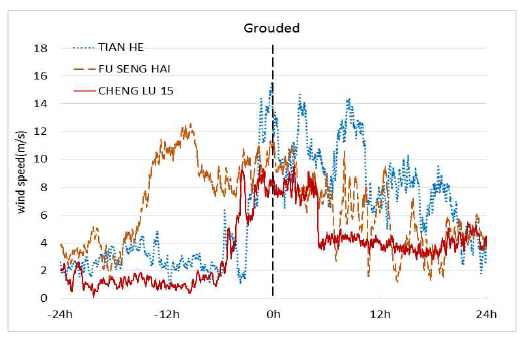
Fig.┬Ā2
48 hours wind speed curve of grounding accidents (ŌĆśOCEAN TANGOŌĆÖ, ŌĆśJE HAEŌĆÖ, ŌĆśBUM JINŌĆÖ)


The graphs show that the accidents did not always occur during the time when wind speed reach at its maximum. ŌĆśFU SENG HAIŌĆÖ, ŌĆśCHENGLU 15ŌĆÖ, ŌĆśCAI XINŌĆÖ, ŌĆśBUM JINŌĆÖ were grounded a few hours after the maximum wind speed appears. Others were grounded near the peak strength of the wind speed. Although the maximum 10-minutes average wind speed of ŌĆśCHENGLU 15ŌĆÖ was recorded as the lowest among them, her accident patterns and situation was similar to others. Therefore, it might be not appropriate to evaluate the stage of upcoming strong wind which could prevent the accidents of the ship simply by the strength of the wind.
Because there are so many factors which can affect shipŌĆÖs grounding accident, such as the shipŌĆÖs shape, the quantity of loading cargo, holding power of the anchor and cable, depth of water area, and geographical features of the coast, and others.
However, it is very difficult to develop an algorithm that can predict the possibility of a grounding accident in real time reflecting all the above factors. There are also some limitations on collecting necessary information related to such elements.
So many countries such as the United Kingdom and the U.S.A have issued the strong wind warning based on the forecasted wind speed. But the warning information is inferred from historical weather data, it means the accuracy of the information can vary depending on wind speed of the time.
In the case of ŌĆśBUM JINŌĆÖ, the 10-minute average wind speed value increased about 6m/s in the range of 30 minutes and then decreased slowly again. It might be somewhat unreasonable to predict the occurrence of strong wind near future only by the large change in such a short time range. Because it can make too much frequent warning on strong wind and be unuseful to seafarers. Therefore, it will be more efficient and practical to judge the sing of weather deterioration by analyzing the data for the range of several hours rather than the short time.
Algorithm for wind warning
It would be essential to issue valuable warnings which let the seafarers have enough time to do right decision making and prohibit the grounding, stranding, dragging anchors, etc. So this study has developed the algorithm that could make 4 warning levels consist of ŌĆśAttention(blue)ŌĆÖ, ŌĆśWarning(yellow)ŌĆÖ, ŌĆśAlert(orange)ŌĆÖ and ŌĆśCritical(red)ŌĆÖ and announce the first warning at least 2 hours before. And also the wind warning levels are calculated based on the changing trend of 10-minutes average wind speed.
In this paper, the basic algorithm for calculating process of the warning levels is described with the data of ŌĆśOCEAN TANGOŌĆÖ accident. Fig. 4 shows the curve of 10-minutes average wind speed for 28 hours of ŌĆśOCEAN TANGOŌĆÖ case. At first, the trend of wind speed change is obtained by using the method of least squares which is a process to find the best fit line to target data(Wolberg, J. 2006).

where t is time, y is wind speed, t is mean time, y is mean wind speed and k is slope and c is constant.
The gradients can be obtained by changing the unit of calculation with hourly basis. Meanwhile, it limits the calculation unit within 1 hour to 6 hours for the purpose of finding out the best curve.
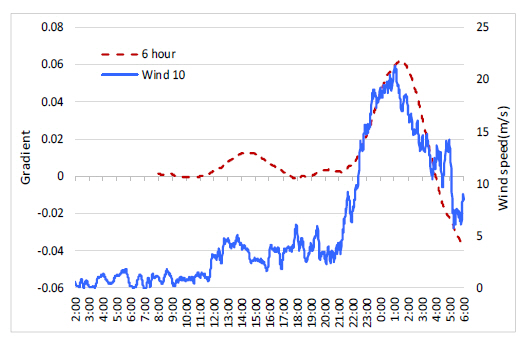
Fig. 5 and Fig. 6 show the gradient curves of 6 cases and the phenomenon in which the fluctuation of the gradients becomes larger as the calculation range becomes shorter. Analyze the other seven accidents, itŌĆÖs get the familiar result. Therefore, 6-hour unit is applied as the calculation period for the method of least squares.


In Fig. 7, 6-hour gradient curve and 10-minute average wind speed curve are displayed together to check whether the gradient value can be used as the index of the strong wind warnings. Although it can indicate the changing trend of wind speed well, the gradient values can tend to be somewhat larger at low wind speed zone under 5m/s from 08:00 to 21:00. It means that only using the gradient values as the warning index, it may not fit in with the reality.
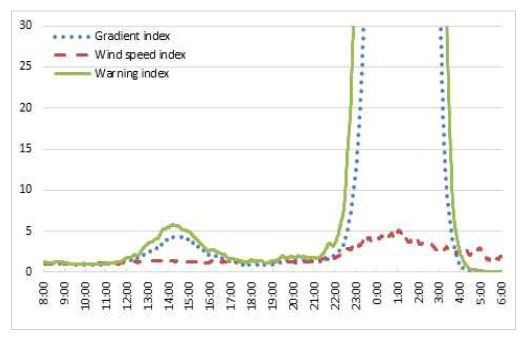
The low wind speeds do not have too much impact on the accidents, but the high wind speed is one of the main causes of the grounding accident. Therefore this study uses the exponential function to process wind speed and gradient values that can decrease the low wind speed and increase the high wind speed to get wind speed index(WSI) and gradient index(GI). The final warning index(WI) is obtained as the product of the wind speed index and the gradient index, and can be given by
where m is 6-hour gradient value, Žģ is 10-minutes average wind speed. The base a is set to about 1.122 so as to be an GI 10 when the 6-hour gradient value is 0.02, and the base b is set to about 1.185 so as to be an WSI 30 when the 10-minutes average wind speed is 20m/s.
Fig. 8 shows the calculation result of the gradient index, wind speed index and warning index for ŌĆśOCEAN TANGOŌĆÖ. We define the numerical range of each warning level as shown in Table 2.

In this study, we calculated the data of 8 grounding accidents to confirm that the algorithm could decide each warning level properly. The results are shown in Table 3, although the warning was issued too early in three cases, but it was found that this algorithm would be useful.

In the case of ŌĆśCAI XINŌĆÖ, the critical warning can be indicated about 5 hours and 50 minutes before, because the typhoon ŌĆśBOLAVENŌĆÖ approached to the water area at that time. In the case of ŌĆśTIAN HEŌĆÖ, the critical level can be issued 1 hour and 37 minutes before her accident. The critical level of ŌĆśBUM JINŌĆÖ and ŌĆśOCEAN TANGOŌĆÖ can be indicated about 2 hours before their accidents. In the case of ŌĆśFU SENG HAIŌĆÖ, the critical level can issue 13 hours and 40 minutes before, and ŌĆśMI NAMŌĆÖ and ŌĆśCHENG LU 15ŌĆÖ can be notified more than 3 hours before their accidents.
If the above 8 vessels used the warning system based on this algorithm, 6 vessels can be warned of any upcoming danger at least 2 hours before and 2 vessels 1 hour and 30 minutes before. In conclusion, this algorithm will provide a strong wind warning, and help seafarers make timely decisions to prevent accidents.
Conclusions
Usually seafarers on watch in the bridge have checked and recorded the change of wind speed or atmospheric pressure to estimate the coming bad weather condition. But these precaution activities have largely relied on the knowledge and past experience of watch-keeping. So it can sometimes cause the crew to be distracted and also cause the marine accidents.
The purpose of this study is to develop the strong wind warning algorithm that can make prior alert to shipŌĆÖs crew members in readiness for the coming strong wind. So the 10-minutes average wind speed data were analyzed to obtain the changing trend of wind speed by the method of least squares. And the WSI and GI were developed because the steep wind speed changes in high wind speed could cause the more dangerous situation than a low wind speed range. WI obtained as the product of 2 indexes was used to determine 4 warning levels : attention(level 1, WI 5), warning(level 2, WI 10), alert(level 3, WI 15), critical(level 4, WI 20).
The strong wind warning algorithm was applied to 8 grounding accidents to find the applicability that could estimate the growing wind speed. We confirmed that it could be used to give an effective warning to watch-keepers who make enough preparation for any dangerous situations such as grounding accident and not under command. In future studies, we would like to apply atmospheric pressure at sea level to calculate more efficient warning index. Because it is known as well that the wind speed has a deep relation with degradation or change of air pressure.
 PDF Links
 PubReader
 Full text via DOI
 Download Citation
 Print
Print


