

Introduction
Currently, the motion response of floating structures is of an intense concern in marine engineering. Floating structures can be disturbed by environmental conditions such as wave, wind and currents. Excessive vessel motions can affect the operability of vessels. In order to maintain its position, mooring is essential to produce a restoring force when displaced. Therefore, it is important to investigate the tension of mooring lines and motion responses of barge in moored conditions. This should be confirmed in its design stage to guarantee the safety of the barge during its operation. A number of researches on the seakeeping assessment of moored floating structure have been performed for the last few decades. In one study, a non-linear mathematical model of a moored floating storage barge was proposed for analysing the behaviour of the barge under various external environmental conditions (Fujii et. al., 1982). In their studyãs mathematical model, the barge was moored in shallow water by dolphins with cell type rubber fenders. A program for predicting the mooring force of the mooring cable on barge model was developed (Natarajan and Ganapathy, 1995). However, there was a limitation to this program as the significant wave loading and dynamics analysis were not considered. The wave interaction with a barge moored was studied based on the finite element method (Shashikala et al., 1995). In their simulation, the barge moored was simulated under regular wave and random wave in head sea. The simulation of analysing the dynamic behaviour of offshore spar platforms was carried out in regular sea waves (Agarwal and Jain, 2003). The spar platform was modelled as a rigid body with degrees of freedom and was connected to the sea floor by using multi-component catenary mooring lines. The motion characteristic of an LNG carrier moored in transverse long period waves were investigated in different loading conditions (Shi et al., 2014). The experiment was performed to investigate the effect of a mooring system on the dynamics of a SPAR buoy-type floating offshore wind turbine (Hong et al., 2015). Particularly, the effect of the Center of Gravity (COG), mooring line spring constant, and fairlead location on the turbineãs motion in regular waves were analysed.
However, the majority of these studies on assessments of seakeeping of moored floating structures only considered in head sea condition. Roll motion has not been previously investigated. In addition, the correlation analysis of the most sensitive motion variables associated with mooring line tension in various wave directions has not been previously investigated. The main purpose of this study is to investigate the motions, acceleration of twin barge and tension of mooring line in regular waves. The experimental investigation of moored twin barge was performed to predict its seakeeping performance in various wave directions. The model test was carried out in a square wave tank in Changwon National University (CWNU). In addition, the twin barge motions and tension of mooring lines in various wave frequencies were also investigated. Particularly, the effect of twin barge motion and vertical acceleration on the tension of mooring line in regular waves are discussed.
Test facilities and test conditions
2.1 Wave basin
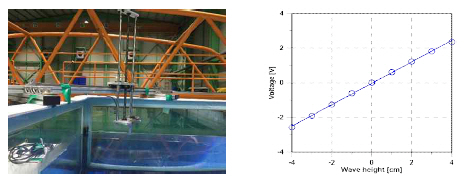
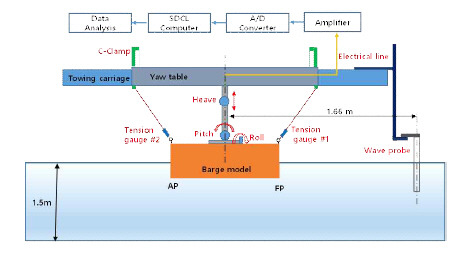
The twin barge model test was conducted in CWNUãs Square Towing Tank as shown in Fig. 1. The length, width and depth of the towing tank are 20 m, 14 m, and 1.8 m, respectively.

The maximum carriageã towing speed is 1.0 m/s. A wave maker is installed at the end of the towing tank and a wave absorber is installed in the opposite side. This device can generate wave heights up to 20 cm and wave length up to 3m.
2.2 measuring device
The heave, roll and pitch of the model were independently measured by three potentiometers as shown in Fig. 2. Since the experiment was conducted in various wave directions and frequencies, it is necessary to evaluate the quality of the waves. Fig. 3 shows the wave probe that was used for measuring the wave height to determine the phase between wave and motion. The phase information was estimated by measuring the incident waves from the wave probe mounted on the towing carriage.
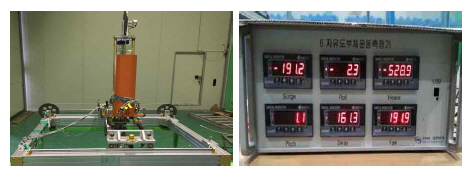
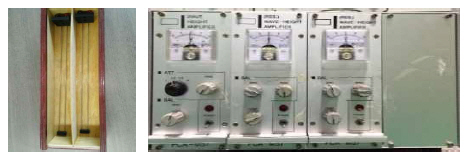
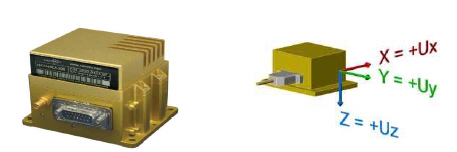
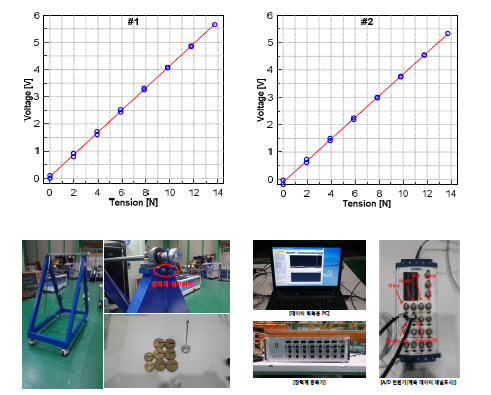
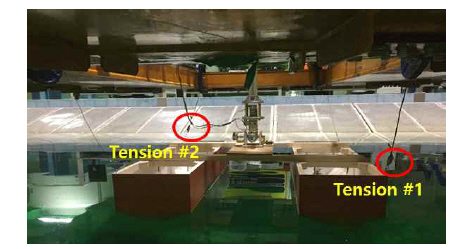
Fig. 4 shows the tension gauges which were used for measuring the tension of the mooring line in the moored condition. In this experiment, two tension gauges #1 and # 2 were used to measure the tension of the mooring line at the bow and stern of the barge model respectively. The tension capacity of each tension gauge WBST-P25 is 25N and the overload tension is 35N. In addition, A/D converter was used for converting an analog signal such as wave prove, barge motion and tension of the mooring line into a digital signal. The acceleration of the barge in waves was measured by NAV440 as shown in Fig. 5. Even though it is possible for NAV440 to measure various motion variables, it was adopted to only measure vertical acceleration. The coordinate system of NAV400 was defined as shown in Fig. 5.

2.3 Twin barge model
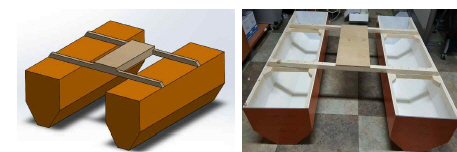
The Twin barge model was designed using SolidWorks software by CWNU in Korea. Fig. 6 shows the barge model in SolidWorks software and the real barge which was used in this experiment. In addition, the principal dimensions of the barge model are as listed in Table 1.
2.4 Test conditions
most tests in regular waves are concerned with the experimental determination of the RAO motion. It is essential to determine the motion amplitudes induced by a variety of different wavelength and frequencies which are related by the dispersion relation. The experiment was carried out in regular waves in seven different wave directions. Table 2 shows the set values for each test condition in regular waves.
Tableô 2
Test conditions
model test
3.1 Wave maker calibration
Since seakeeping analysis is done for the assessment of the ship motion in waves, the wave characteristics, as well as the response of the ship, should be analyzed in advance. The wave height is measured through the amplifier and wave probe device in the model test. Therefore, it is essential to establish the relationship between the measured wave height and the voltage from the wave probe amplifier. Fig. 7 shows the setup of wave probe calibration, and the relationship between wave height and output voltage of the amplifier.
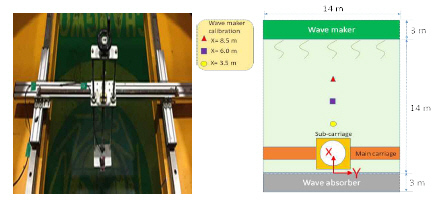
Wave maker calibration is also necessary in order to determine the input stroke of the wave maker system for each wave frequency. Wave maker calibration for different near frequencies were performed at three points to find the input stroke value in the wave maker system, as shown in Fig. 8. The result of the wave evaluation for different frequencies are as shown in Figs. 9ÿ§10. The results of the input stroke values of the wave maker system are as listed in Table 3.
Tableô 3
Input parameter into wave maker system


3.2 measuring device calibration
The motion measuring device measures the heave, roll, and pitch. In this system, a potentiometer was used for measuring the motions. It is necessary to determine the relationship between motion displacement and output voltage. Fig. 11 shows the relationship between motion measuring device and output voltage of the amplifier. The calibration for the tension gauge and the relationship between tension and output voltage of the amplifier is as shown in Fig. 12.

3.3 Ballasting and inclining test
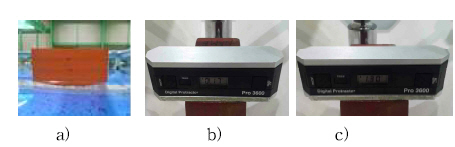
It is critical to ensure that the mass distribution of the model test and the design water line match exactly. In order to approximate the vertical and longitudinal mass distributions, the mass moment of inertia for Gm and the transverse axis must be the same. Since the barge is symmetrical model, ballasting for each hull is used for this process. Fig. 13a shows the ballasting for one hull. The Gm value was 0.1 m and was obtained through the inclining test by moving the weight as shown in Figs. 13 bÿ§13c. According to the target Gm, the angle of inclination at the time of application of the inclined moment by the small weight is determined using Eq. (1). In order to change the heel angle during the test, weight should be moved is as shown in n Figs. 13bÿ§13c. Table 4ÿ§5 shows the result of inclining test.
Fig.ô 13.
Ballasting and inclining test (a. Ballasting, b. Before weight moving, c. After moving weight)
Tableô 5
Measured heal angles during inclining test
| Item | Measured value [deg] | Heal angle [deg] |
|---|---|---|
| Start point measured | 0.17 | - |
| Moving weight to port | 1.30 | 1.13 |
| Moving weight to Starboard | -0.99 | 1.16 |
where, w is the mass moved , W is mass of model ship, ly is the distance which the mass is moved, GM is metacentric height.
3.4 Inertia test
The radius of gyration in pitch motion kyy is 0.25 of the shipãs length. The inertia test was performed by using inertia swing. Fig. 14aÿ§14b shows the processing of inertia swing calibration with a weight of 10 kg and different distances from the center of the inertia swing device. Then, the inertia test of measuring value of barge model was performed to obtain target moment of inertia Iyy as shown in Fig. 14c. The result of target moment of inertia Iyy is listed in Table 6.

3.5 Installation of model test
The barge model was attached to the motion measuring device in the middle of the measuring frame of the sub-carriage. Fig. 15 shows the detailed setup of this experiment. The center of gravity of the model should be matched to the towing line as much as possible. The wave probe was installed at 1.66 m in front of the center of the model on the right side of the yaw table without being affected by the wave radiated by the ship. Fig. 16 shows the real setup of the barge test which describes the test equipment and barge model installation. In this experiment, the model was tied by four mooring lines, first mooring line and second mooring line are located on the port side and starboard side at the bow, respectively. The remaining two mooring lines are located on the port side and starboard side at the stern as shown in Fig. 16. The tension of mooring lines are measured by tension gauges. Tension gauges #1 and tension gauge #2 are located at the bow and stern, respectively.
3.6 Data analysis
Since the wave system cannot be installed at the center line of the model motion, it is installed on the right part of the front as shown in Fig. 15. Therefore, it is necessary to estimate the wave phase at the midpoint of the modelãs motion by using the measured value of the installed wave height, and then calculating the phase difference between the wave and the modelãs motion. Wave frequency w, wave number k, phase üçöÑ , wave amplitude A and X is positive axis in the direction of the wave propagation in the tank coordinate system can be expressed Eq. (2). In addition, the measurement value of the wave probe installed at a distance X0 as shown in Eq. (3). Then, the measured value of the motion expressed as the motion amplitude Aöƒ and the wave-motion phase difference üçöƒöÑ as shown in Eq. (4).
where,
In the encounter wave frequency equation, U is the ship speed and ö´w is wave direction. AöÑs, AöÑc, Aöƒc, Aöƒs can be obtained by processing the values measured from the wave height and the motion measurement device, and applying it to Eqs. (5)ÿ§(6) to calculate the wave amplitude, wave phase, motion amplitude, phase between wave and ship motion. However, since the wave amplitude used to obtain the motion response operator has an error such as a wave run-up in the value obtained by Eq. (5). So the original set value is used.
Unlike motion response and wave elevation, tension and the vertical acceleration is not linear. So, it is not reasonable to use least square or Fourier transformation. The tension of the mooring line was estimated by taking the average peak value of the measuring tension as shown in Fig. 17. The blue line is the measured value and the red line is the fitted value.
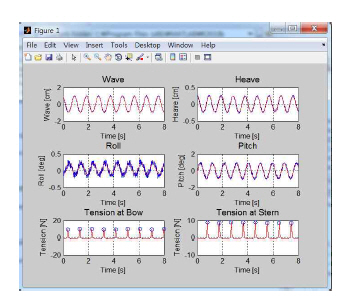
In addition, the upward and downward vertical acceleration could be obtained by taking the average peak value of vertical acceleration as shown in Fig. 18. The vertical acceleration can be estimated by Eqs. (7)ÿ§(8). In addition, the measured vertical acceleration is based on gravitational acceleration. Therefore, the reference is the value which is multiplied by gravitation acceleration. If vertical acceleration is one, then dimensional value is equal to gravitational acceleration.

where, h max i
where, xi could be a motion variable such as heave, roll, pitch and vertical acceleration. In addition, yi is mooring line tension. x and y are the mean of the x and y, respectively.
Result
4.1 motion response results of model test in moored condition
The results of heave RAO, roll RAO, pitch RAO of barge model for the seven wave directions are as shown in Fig. 19. It can be seen that wavelength and wave direction have a significant effect on the characterizing the motion response. Heave responses and pitch response become small in short waves and the large in very long waves. In addition, roll response becomes small when the wave direction approaches 180ô¯ and 0ô¯. Roll becomes largest when the wave direction approaches 90ô¯.

4.2 Tension of the barge model in moored condition
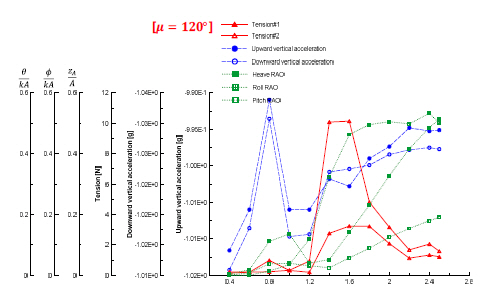
Figs. 20ÿ§26 show the results of the tension of the mooring line at the bow and stern in the barge model under different wave directions. It can be seen that, in high wave frequency, there is a slight effect on the tension of mooring line. However, in low wave frequency, there is a significant effect on the tension of the mooring line. It can be noted that when wave frequency reduces, the tension of mooring line also reduces in 7 wave directions. Generally, there was a dramatic decrease in the tension of the mooring line at the bow when wave direction changes from 180ô¯ to 0ô¯. In contrast, the tension of the mooring line at stern slightly increased when the wave direction changed from 180ô¯ to 0ô¯. The maximum tension of the mooring line occurred when the wave heading angle approached 180ô¯ at the bow position. The mooring line tension could be caused by vertical acceleration as well as motion amplitude.Figs. 21, 22, 23, 24, 25


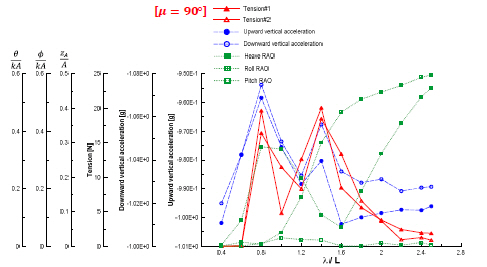

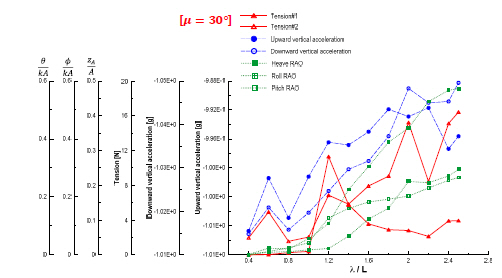
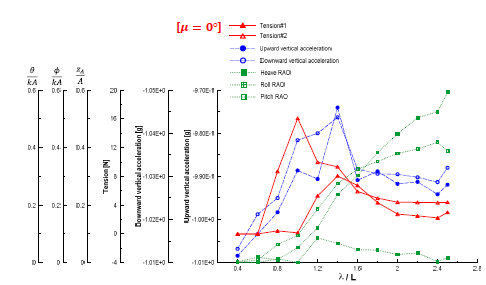
4.3 Vertical acceleration in moored condition
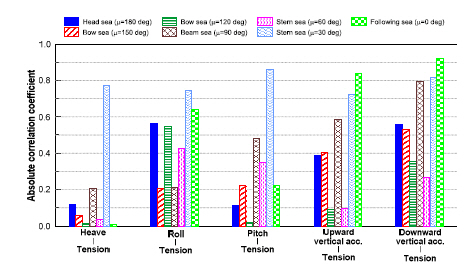
Figs. 20ÿ§26 show the comparison between the upward and downward vertical acceleration. The magnitude of upward and downward vertical accelerations appear to have the largest value in beam sea condition. The absolute correlation coefficients which describes sensitive motion variables with mooring line tension are as shown in Fig. 27. Tension is mainly caused by downward vertical acceleration compared to other motion variables.
Conclusion
The experimental investigation of motion responses of moored barged was performed in regular waves in seven wave directions. From the analysis of motion response of the moored barge and tension of the mooring line in various wave frequencies, the concluding remarks are as follows:
Firstly, it is noted that the characteristics of motion responses of a moored barge under different loading conditions can be affect the tension of the mooring line. Since the barge is a symmetrical object, the barge motions have a similar trend in cases of wave direction as follows: 180ô¯ with 0ô¯, 150ô¯ with 30ô¯, 120ô¯ with 60ô¯. In addition, the amplitude of heave, roll and pitch were noted to change dramatically at each wave frequencies and wave direction.
Secondly, there is a slight effect on the tension of mooring line in high wave frequency. In contrast, there is a significant effect on the tension of the mooring line in low wave frequency. When wave frequency reduces, the tension of mooring line reduces in 7 wave directions, too. In addition, the maximum tension of mooring line was noted to be 25 N when wave heading angle approaches to 180ô¯ at the bow position. Therefore, it is necessary to design the mooring line with a material whose strength should be about 25 N in order to ensure that the barge model works in operation safely.
Finally, vertical acceleration near the motion measuring position was measured in order to analyze the correlation between the motion values and the vertical acceleration. As a result, tension was noted to be caused mainly by downward vertical acceleration compared to other motion variables. In stern sea (ö¥=30ô¯) condition, the trends between tension and motion variables including motion displacement and acceleration appeared to be relatively linear.
 PDF Links
 PubReader
 Full text via DOI
 Download Citation
 Print
Print


