

Introduction
In terms of maritime logistics amount in Northeast Asia, China has sustained a high-speed growth of more than 8% per year. This is in stark contrast to Japan, which has suffered from sustained recession for more than 10 years. ChinaŌĆÖs production has increased quickly compared to what the marine cargo handling volume around the world has shown. In particular, transshipment cargo handling amount has rapidly progressed, compared to the increase in container volume.
The economic development of these Northeast Asian countries has led to the increase of each regionŌĆÖs maritime cargo handling volume. Because of this, the shape of port networks has changed to a polynuclear system hub port, which is the centrality and intermediacy of the large ports.
There are limits to these studies. For example, most studies of time series analysis were analyzed except that of China and Asian related variables. In particular, there are limitations because most of the studies of transshipment volume are estimated and forecasted using Chinese and Japanese economic growth outlook.
There are hardly any studies concerning the changes in the competitive port development projects of the Northeast Asian countries' ports, and port call strategy of shipping companies to port call in the North China port, especially using China-related variables which have the greatest impact on container cargo volume in Korean port. Therefore, in this study, by using the time-series data and China-related variables, the container throughput of Korean ports has been estimated.
By using the time series data to respond to changes in the port environment, it estimated the handling volume of the entire container associated with centrality, and the transshipment container volume associated with intermediacy. In addition, the container throughput of Busan port was also estimated together as a Korean representative port.
However, this port throughput situation has changed since the 2008 financial crisis in the US. Port throughput has plummeted. The disparity of large ports and small ports became larger, and liner routes of shipping companies were also changed. It is necessary to correctly estimate port throughput after the 2008 financial crisis in a new light.
This study will discuss the estimated container throughput in Korean ports, and assurance that the proper port facilities corresponding to the maritime cargo (which is handling the amount of increase) and the suggestions to the port policy of the Korean government after the 2008 financial crisis.
Literature Review
Because of the equipment expansion of the port logistics industry is based on port volume prediction, port volume prediction has important implications that have a significant influence on port development in the position of the individual ports. Therefore, it is necessary to perform prediction in consideration of the various domestic and international environmental uncertainties, and it can be displayed with different results based on the prediction model that is always present.
OSC (2003) studied that there is increase in customer demand and raw materials and intermediate goods of industry demand due to the economic growth of the last 10 years. The port environment has drastically changed, due to a variety of factors. For one, radical containerization of general cargo, bulk cargo and intermediate goods occurred. Second, there was an increase in the size of vessels due to greater trade volume. Third, there was significant port ownership of large shipping companies. Finally, port productivity improved. All of these factors were taken into account while predicting port throughput. Also, they were predicted by mixing two values: the long-term GDP growth rate of positive-negative, and the short-term GDP rate of IMF for container throughput prediction. In particular, the global uncertainty (i.e. double-dip fear of US economy, Europe long-term recession of Japan and Western, diffusion of the Iraq War, and terrorism etc.) acted as a negative scenario in GDP growth rate. On the other hand, in the US economic recovery, stabilization of the East Asian economies and currencies, and diffusion of FTA applied to the positive scenario have been utilized for prediction.
Drewry (2010) was a ŌĆ│Container Market 2010 / 11ŌĆ│ report, and presented a regional medium term prediction about port throughput between 2010 and 2015 in the world. For their prediction, they referred to the data published in the IMF of 2010. They forecasted port throughput using trading volume of the world's goods and services, and took advantage of the predictive index of consumer prices in major industrialized countries (US, EU, Germany, Japan and England etc.) and BRICs (Brazil, Russia, India and China) which are also the major developing countries. In particular, they emphasized the surprising rise of major economic indicators of China, which caused an increase in the container handling amount over the past few decades.
Zhao et al. (2011) implied that these are dominated by quantitative methods such as regression forecasting method (particularly ARIMA) because most of the existing methods deduce future trends or pattern based on changing time sequences of the past. Among existing studies, auto regressive integrated moving average (ARIMA) models are being applied most frequently. Then, exponential smoothing class of time-series models is applied less frequently (Coshall and Charlesworth, 2011). However, one class of existing forecasting models does not continuously dominate others and many disputes are currently progressing about choosing the method. For instance, it was demonstrated by some researchers that the autoregressive integrated moving average (ARIMA) model outperforms error collection models (ECM) (Gonzalez and moral, 1995), dynamic harmonic regression (DHR) (Garcia-Ferrer and Queralt, 1997), Winters models (Lee et al., 2008), artificial neural network (ANN) and multivariate adaptive regression splines (MARS) (Lin et al., 2011).
In the previous studies, they estimated port throughput using terminal facilities (total area, berth, number of C/C and length etc.), economic variables (GDP, REER and economic index etc.) and time series data (ARIMA amd GARCH etc.).
Based on these studies, we estimated ChinaŌĆ▓s trade scale as an explanatory variable for estimating the transshipment cargo volume, and we also estimated the index representing the economy of the world (including Korean economy) and real effective exchange rate of Korea Won as an explanatory variable for estimating the port throughput.
Port Throughput Estimation by Time-Series Data
3.1 Setting the Research Model
As mentioned above, the key points of hub port are centrality and intermediacy. The most important related centrality data is port throughput. It is determined by factors that exchange rate, domestic economy and global economic and other factors. On the other hand, important factors that determine intermediacy can be expressed in transshipment rate and transshipment cargo volume. There was an increase in the amount of ships and liners because there was a greater amount of import and export cargo. Naturally, with more throughput in nearby ports, transshipment cargo volume also increased. Therefore, the factors determine the transshipment cargo volume rate. It is possible to choose import and export cargo volume, flow rate of neighboring countries, port cost and others.
Estimating port throughput of Korean ports, i.e. port throughput and transshipment cargo volume, is believed to give important implications in order to explore the development strategy of Korean port. Therefore, this study tries to estimate port throughput and transshipment cargo volume using time-series data.
Based on studies of Rose (1991) and Coto-Millan et al. (2005), an equation describing port throughput can be easily explained below.
Here, MT represents port throughput of Korea (excluding transshipment cargo volume), REER is the real effective exchange rate of Korea Won (Ōé®), and WOR indicates the economy of the world. Also, Ei is the exchange rate for Korean won to the currency of country I, p i ŌłŚ
In other words, port throughput has relationship with the real effective exchange rate of Korea Won (Ōé®), Korean economy, and the global economy. Also it has relationship with price variables that affect the import and export (shipping costs, raw material prices, etc.). Rise of the real exchange rate leads to increasing exports and decreasing imports, because more exports causes more imports in Korean import and export structure. The effect of the positive (+) can be expected to become more significant. Strong Korean economy appears to increase the growth and export revenue, it can be expected to increase port throughput in Korea. Also, strong global economy can be expected to increase port throughput in Korea through an increase in Korean exports. On the other hand, increase in transportation costs can be expected to reduce port throughput in Korea.
The second equation that describes the transshipment cargo volume of Korean ports can be seen below.
Here, NT is a transshipment cargo volume, CTV is a trade volume of China, MT shows a container throughput excluding the transshipment cargo volume.
Because the most significant impact on port transshipment scale in Korea is the entry throughput from China, we included ChinaŌĆ▓s trade scale as an explanatory variable. Increase of trade volume with China can be expected to increase the transshipment cargo volume of Korean ports. Increase of port throughput is expected to increase the transshipment cargo volume through an increase in number of liner; rise of the real effective exchange rate of the Korean Won. In other words, the decline in the real value of the Korean Won, is not only relatively lower port costs associated with the increases in the transshipment cargo volume, but it can also can be expected to increase the transshipment cargo volume through increasing port throughput.
Port throughput can separate container import and export throughput in Korean port (KMT; excluding transshipment cargo volume) and container import and export throughput in Busan port (BMT; excluding transshipment cargo volume) in equation 1, transshipment cargo volume also can separate container transshipment cargo volume in Korean port (KNT) and transshipment cargo volume in Busan port (BNT) in equation 2.
3.2 Data
The data from SP-IDC of the Ministry of Maritime Affairs and Fisheries was used in finding several points of data. Among the data collected was container throughput (first for Korean, then for Busan ports), as well as transshipment cargo volume (again, for Korean, then for Busan ports).
World import value and China's trade volume variables as determining port traffic were collected in KITA (Korea International Trade Association), Korean GDP variables were collected from the Bank of Korea, and real effective exchange rates of Korean Won were collected from the United Nations. The estimation period is from January 2008 to December 2013.
3.3 Empirical Analysis
Because of data constraints, as an index representing the economy of the world (WOR), we used the world import value (WIV) as a substitute variable. The index stood for the economies of Korea and China, and used the Korean GDP and trade value of China.
Summaries of the variables used in the empirical analyzes are as follows.1)
KMT:
container throughput in Korean port (TEU)
KNT:
container transshipment cargo volume in Korean port (TEU)
BMT:
container throughput in Busan port (TEU)
BNT:
container transshipment cargo volume in Busan port (TEU)
WIV:
world import value (Dollars, billions)
KGDP:
Korean GDP (one billion Won)
CTV:
trade value of China (Dollars, billions)
REER:
real effective exchange rate of Korean Won
3.3.1 Unit Root Test
Because the eight variables to be analyzed are time series variables, we conducted a unit root test by Phillips-Perron, and an Augmented Dickey-Fuller test.
The results are shown in Table 1.
Table┬Ā1
Results of unit root test
| Level | 1st difference | |||
|---|---|---|---|---|
| PP-Adj. t-Stat | ADF-Adj. t-Stat | PP-Adj. t-Stat | ADF-Adj. t-Stat | |
| KMT | -4.195* | -2.112 | -14.673* | -3.034 |
| KNT | -4.342* | -4.441* | -15.800* | -12.109* |
| BMT | -3.680* | -2.576 | -12.718* | -2.360 |
| BNT | -4.316* | -4.419* | -17.369* | -12.337* |
| WIV | -1.936 | -1.945 | -8.551* | -8.534* |
| KGDP | -3.681* | -2.378 | -14.563* | -2.225* |
| CTV | -4.324* | -2.481* | -11.980* | -10.040* |
| REER | -3.298** | -3.346** | -5.742* | -5.882* |
In order to modify the correlation between the error terms, we estimated a long term relation including the leads and lags of the explanatory variables in the cointegration equation using dynamic OLS (DOLS) of Stock and Watson (1993) and fully modified OLS (FMOLS) of Phillips and Hansen (1990).
In this study, a port throughput of Korea was estimated through an analysis of time series by the use of explanation variables like Korean GDP, real effective exchange rate, world economic performances and the volume of trade in China etc.
The estimation equation is as follows.
-
Estimation equation 1:
-
Estimation equation 2:
-
Estimation equation 3:
-
Estimation equation 4:
-
Estimation equation 5:
-
Estimation equation 6:
3.3.2 Container Throughput Estimation
The container throughput mainly refers to trade volume of industrial products. As expected, it can be explained on Korean GDP, real effective exchange rate of Korean Won and world imports value variables.
Looking at the estimation equation 1, a 1% increase of Korean GDP were found to increase the container throughput at about 1.1 to 1.3%, and the rise of the real effective exchange rate of Korean Won by 1 % were found to increase the container throughput from 0.5 to 0.8 %. However, changes in the world import value were found to not affect the container throughput in Korean ports.
On the other hand, these same variables can also be described in the Busan port of container throughput. These coefficients were also similar with the estimation equation of Korea total container throughput (estimation equation 1). Coefficients of GDP were about 1.3 to 1.5, the coefficients of the real effective exchange rate of Korean Won had appeared in about 0.48 to 0.7, and coefficients of the world import value variables were statistically significant at -0.016 in the OLS and FMOLS. Table. 2
Table┬Ā2
Results of estimation port throughput of Korean and Busan Port
| (1) KMT / KGDP, REER, WIV | (4) BMT / KGDP, REER, WIV | |||||
|---|---|---|---|---|---|---|
| OLS | DOLS | FMOLS | OLS | DOLS | FMOLS | |
| C | -4.843 (-4.127) | -4.453 (-2.451) | -5.203 (-3.871) | -6.191 (-4.876) | -6.832 (-3.113) | -7.177 (-4.274) |
| KGDP | 1.330* (12.703) | 1.185* (6.300) | 1.365* (11.128) | 1.431* (12.626) | 1.376* (6.056) | 1.516* (9.893) |
| REER | 0.534* (4.574) | 0.789* (3.217) | 0.513* (3.598) | 0.504* (3.995) | 0.743* (2.507) | 0.485* (2.724) |
| WIV | -0.010 (-1.492) | 0.009 (0.551) | -0.009 (-1.122) | -0.016* (-2.166) | -0.001 (-0.009) | -0.016** (-1.665) |
| Adj. R^ | 0.825 | 0.867 | 0.820 | 0.811 | 0.849 | 0.805 |
3.3.3 Transshipment Cargo Volume Estimation
The container transshipment volume can be explained through the container throughput, trade volume of China and real effective exchange rate of Korean Won variables. A 1% increase in the trade volume of China was found to increase the container transshipment volume about 0.6%. A result that was estimated by container throughput (TEU) to a variable, increase of port throughput at 1% was found to increase the container transshipment cargo volume by about 1.3%. However, changes in real effective exchange rate of Korean Won were found to not affect transshipment cargo volume. Table. 3, 4
Table┬Ā3
Results of estimation port transshipment cargo volume of Korean port
| (2) KNT / KMT, REER | (3) KNT / CTV, REER | |||||
|---|---|---|---|---|---|---|
| OLS | DOLS | FMOLS | OLS | DOLS | FMOLS | |
| C | -3.916 (-6.198) | -4.292 (-3.954) | -4.592 (-4.718) | 7.945 (13.149) | 7.652 (6.200) | 7.429 (7.608) |
| KMT | 1.243* (28.136) | 1.299* (15.511) | 1.293* (18.367) | |||
| CTV | 0.631* (17.476) | 0.661* (9.634) | 0.665* (11.677) | |||
| REER | -0.128 (-1.428) | -0.221 (-1.107) | -0.135 (-0.886) | 0.086 (0.642) | 0.099 (0.330) | 0.141 (0.632) |
| Adj. R^ | 0.924 | 0.931 | 0.921 | 0.825 | 0.823 | 0.818 |
Table┬Ā4
Results of estimation port transshipment cargo volume of Busan port
| (5) BNT / BMT, REER | (6) BNT / CTV, REER | |||||
|---|---|---|---|---|---|---|
| OLS | DOLS | FMOLS | OLS | DOLS | FMOLS | |
| C | -3.359 (-6.980) | -3.379 (-4.635) | -3.671 (-5.575) | 7.902 (13.140) | 7.718 (6.400) | 7.423 (7.757) |
| BMT | 1.239* (36.639) | 1.265* (22.993) | 1.261* (26.376) | |||
| CTV | 0.649* (18.054) | 0.687* (10.253) | 0.685* (12.274) | |||
| REER | -0.168* (-2.348) | -0.244** (-1.744) | -0.168 (-1.559) | 0.052 (0.395) | 0.027 (0.094) | 0.094 (0.431) |
| Adj. R^ | 0.953 | 0.964 | 0.952 | 0.833 | 0.835 | 0.826 |
On the other hand, the estimated results of the container transshipment cargo volume of Busan port (estimation equation 5 and 6) were found to not have a significant difference from the estimated results in the container transshipment cargo volume of Korean port. This is because the container transshipment cargo volume of Busan port accounts for more than 80% of container transshipment cargo volume of Korean port.
Port Container Throughput Estimation by ARIMA Model
4.1 Data Description and Identification
The regression models of the estimated port throughput and port transshipment cargo volume, including the related-China variables, were estimated to be used after the 2008 financial crisis. In this analysis, simply using the time-series data, it was determined that the situation after the 2008 financial crisis had no effect. It also was too short a period for the ARIMA model to be used. We analyzed the time-series analysis by ARIMA model using monthly data of port throughput and port transshipment cargo volume of Korean port, and the port throughput and port transshipment cargo volume of Busan port.
Before setting the model, we visually measured the trend and seasonality using the time series plot and autocorrelation functions. The result of the estimated autocorrelation function (ACF) showed a gradual decrease to "0" which is the result of estimated partial autocorrelation function (PACF). In addition, it had a strong seasonal pattern in a 12 months period.2)
Moreover, stationarity of time-series needed to be estimated by mixing seasonal or periodic factors. Because monthly port throughput of Korea and Busan port had non-stationary3) root units, there were autocorrelation and periodicity in the level dependent variable and the dependent variable of port throughput.
Therefore, to accurately predict by time series data from 2000 to 2014 and estimate the port throughput in consideration with seasonality or periodicity, it is necessary to predict future port throughput after finding the optimal model by estimating some of ARIMA model and application.
4.2 Model Selection
4.2.1 Port Throughput Estimation of Korean Port
After the combination of port throughput of non-stationary, seasonality and periodicity in Korean port, we compared the selected models that include seasonal multiplicative ARIMA (2,0,1)(1,0,1)12, seasonal multiplicative ARIMA (2,0,2)(1,0,1)12, and seasonal multiplicative ARIMA 2,0,1)(1,0,0)12. The result of the comparison, t-value and p-value, appeared significant with a 5% level in all the variables in ARIMA (2,0,1)(1,0,1)12 model. The explanatory power of the Q-statistic models is seen through the coefficient of the determining value, and the fit of the models is seen through the F-value. As a result, we checked the high coefficient of determination value and high F-value in ARIMA (2,0,1)(1,0,1)12 model and found that the predictive model is quite satisfactory.
4.2.2 Port Transshipment Cargo Volume Estimation of Korean Port
After the combination of port throughput of non-stationary, seasonality and periodicity in Korean port, we compared the selected models that include seasonal multiplicative ARIMA (2,0,1)(0,0,1)12, seasonal multiplicative ARIMA (1,0,2)(0,0,1)12, and seasonal multiplicative ARIMA (1,0,1)(0,0,1)12.
The results of comparison, t-value and p-value, appeared significant with a 5% level in all the variables in the ARIMA (2,0,1)(0,0,1)12 model. The explanatory power of Q-statistic models is seen through the coefficient of determining value, and the goodness of fit of models is seen through the F-value. As a result, we checked the high coefficient of determining the value and high F-value in ARIMA (2,0,1)(0,0,1)12 model and we found that the predictive model is quite satisfactory.
4.2.3 Port Throughput Estimation of Busan Port
After the combination of port throughput of non-stationary, seasonality and periodicity in Korean port, we compared the selected models that include seasonal multiplicative ARIMA (2,0,2)(0,0,1)12, seasonal multiplicative ARIMA (2,0,1)(1,0,1)12, and seasonal multiplicative ARIMA (2,0,2)(1,0,1)12.
In the results of the comparison, t-value and p-value, appeared significant with a 5% level in all the variables in ARIMA (2,0,2)(0,0,1)12 model. The explanatory power of Q-statistic models is seen through the coefficient of determining value, and the goodness of fit of models is seen through the F-value. As a result, we checked the high coefficient of determining the value and high F-value in ARIMA (2,0,2)(0,0,1)12 model and we found that the predictive model is quite satisfactory.
4.2.4 Port Transshipment Cargo Volume Estimation of Busan Port
After the combination of port throughput of non-stationary, seasonality and periodicity in Korean port, we compared the selected models that include seasonal multiplicative ARIMA (1,0,2)(0,0,1)12, seasonal multiplicative ARIMA (1,0,1)(0,0,1)12, and seasonal multiplicative ARIMA (2,0,2)(1,0,1)12.
In the results of the comparison, t-value and p-value, appeared significant with a 5% level in all the variables in ARIMA (1,0,2)(0,0,1)12 model. The explanatory power of Q-statistic models is seen through the coefficient of determining value, and the goodness of fit of models is seen through the F-value. As a result, we checked the high coefficient of determining the value and high F-value in ARIMA (1,0,2)(0,0,1)12 model and we found that the predictive model is quite satisfactory.
4.3 Forecasting Port Throughput and Port Transshipment Cargo Volume
4.3.1 Forecasting Port Throughput of Korean Port
Figure 1 shows the estimated and forecasted port throughput in Korean port using seasonally multiplicative ARIMA model.
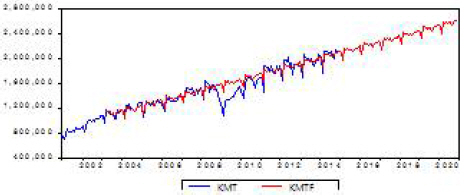
Based on the model, we forecasted port throughput of Korean port for the next seven years (72 months) from 2015 to 2020. As a result, there is some increase or decrease from 2015, by month and year, starting from 25,661,095 TEU in 2014 until 30,864,461 TEU in 2020. It showed a tendency of increase at an annual sustainable average of about 3.9%.
4.3.2 Forecasting Port Transshipment Cargo Volume of Korean Port
Figure 2 shows the estimated and forecasted port transshipment cargo volume in Korean port using seasonally multiplicative ARIMA model.
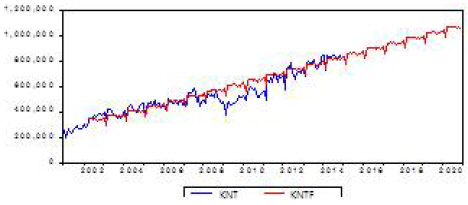
Based on the model, we forecasted port throughput of Korean port for the next seven years (72 months) from 2015 to 2020. As a result, there is some increase or decrease from 2015, by month and year, starting from 10,259,537 TEU in 2015 until 12,765,508 TEU in 2020. It showed a tendency of increase at an annual sustainable average of about 4.5%.
4.3.3 Forecasting Port Throughput of Busan Port
Figure 3 shows the estimated and forecasted port throughput in Busan port using seasonally multiplicative ARIMA model.
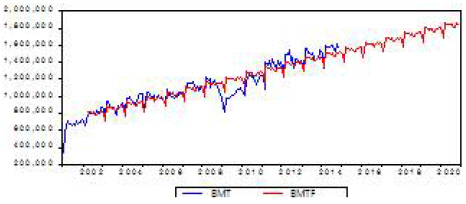
Based on the model, we forecasted port throughput of Korean port in the next seven years (72 months) from 2015 to 2020. As a result, there is some increase or decrease from 2015, by month and year, starting from 18,502,183 TEU in 2014 until 21,986,526 TEU in 2020. It showed a tendency of increase at an annual sustainable average of about 3.5%.
4.3.4 Forecasting Port Transshipment Cargo Volume of Busan Port
Figure 4 shows the estimated and forecasted port transshipment cargo volume in Busan port using seasonally multiplicative ARIMA model.
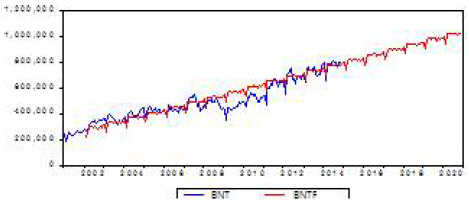
Based on the model, we forecasted port throughput of Korean port for the next seven years (72 months) from 2015 to 2020. As a result, there is some increase or decrease from 2015, by month and year, starting from 9,751,880 TEU in 2014 until 12,212,762 TEU in 2020. It showed a tendency of increase at an annual sustainable average of about 4.5%.
Conclusion
The growth of Northeast Asian trade has been supported by China's economic development and the recovery of the Japanese economy. However, regional growth has not been the only factor in this increase of trade. There has also been an expansion of Northeast Asian-North American trade.
Port development policy that was started by the competition of hub port of Asia countries is based on medium-long term plan. Because it needs such large government funding, accurate estimation is required for the evaluation of the proper port facilities.
This port throughput situation has changed after the 2008 financial crisis from US. Port throughput has plummeted. The disparity between large ports and small ports became larger, and liner routes of shipping companies were also changed. It is necessary to take these new factors into account to correctly estimate port throughput after the 2008 financial crisis.
Therefore, in this study, we estimated port traffic in 2008 to 2013 using time-series data.
First, port throughput; 1 % increase of Korean GDP were found to increase the container throughput about 1.1 to 1.5 %, and the rise of the real effective exchange rate of Korean Won of 1 % were found to increase the container throughput from 0.5 to 0.8 %.
Second, the port transshipment cargo volume; Trade volume with China accounted for a large proportion. 1% increase of trade volume of China was found to increase the container transshipment volume from about 0.6 to 0.7 %.
In these results, because based on studies of Rose (1991) and Coto-Millan et al. (2005) we just considered about 3 variables for estimating port traffic, there are low significance relation each variables. It needs to study at some length in the future.
Also, we made several seasonally multiplicative ARIMA models using monthly data in 2001 to 2014 for validity of data because data of transshipment cargo volume were systemized after 2000.
Based on the model, we forecasted port throughput and port transshipment cargo volume for the next six years (72 months) from 2015 to 2020. As a result, the port throughput of Korean and Busan ports were forecasted by increasing the annual average from about 3.5% to 3.9%. The transshipment cargo volume was forecasted by increasing the annual average about 4.5%. Therefore, because of the increase of the transshipment cargo volume and despite the facility expansion in Busan port of 14 million TEU in 2011, it is likely to face a shortage of facilities soon. In particular, the case of transshipment cargo volume in Korea port has higher increase of transshipment cargo volume than the rate of increase in port throughput. This is interpreted as a phenomenon associated with the development of Chinese ports, such as the growth of Shanghai port.
In these results, port transshipment cargo volume in Korean port and Busan port are falling short of real port transshipment cargo volume of Korean port 7% to 16% since 2000. Because of property of time series analysis, especially ARIMA, it can not consider about another variables (rapidly changing world situation, Chinese economy as a related country of transshipment and variety variables etc.). Therefore it needs to study and supplement with the methods of estimate port throughput and port transshipment cargo volume in-depth in the future.
This study that port throughput estimation using quantitative methods has significant meaning for establishing port policy in the future.
In order to efficiently establish and implement a master plan of ports, in preparation for the demand of port traffic, it is necessary to establish long-term and overall development plan based on the estimated port traffic. And, in order to increase port traffic in the future, it needs (1) the industry and corporate policy to increase the manufacturing industry and trade value, (2) the port facilities improvement and customs clearance, system improvement and attraction of port hinterland and domestic and foreign companies for the increasing transshipment cargo volume, (3) to establish multimodal transport system, (4) and to implement the active utilization strategies in Korea-US FTA, Korea-EU FTA, and Korea-China FTA.
In this study, we analyzed and forecasted port throughput for the port development and port development plan through the prediction and estimation of port throughput demand of Korea and Busan port. It is necessary to take into consideration some of the previously described improvement policies and institutions to increase the port throughput more accurately, as well as to analyze the activation strategy. Also, there are too many studies about port throughput estimation. however these studies need to consider about various methods about port throughput estimation by supplement with limits of previous methods.
Finally, based on this study, it needs to estimate port traffic other ports in Korea using various methods for establishing a port policy.
 PDF Links
 PubReader
 Full text via DOI
 Download Citation
 Print
Print


