

Introduction
1.1 Background
Expressways mean the high-speed arterial highways with a high level of efficiency and safety. However, most of expressways don't play their roles by the high rate of the medium/large-sized vehicles of about 13% and increased traffic. In addition it is not easy to continue to build new expressways because of limited budget and time. So, it is absolutely needed to improve the mobility and efficiency of existing expressways instead of constructing new ones.
1.2 Objectives
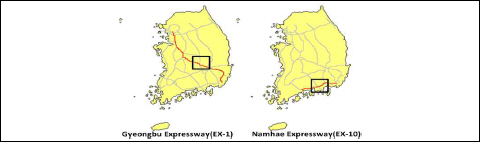
Study expressways as shown in Fig. 1 are showing travel delay by the higher rate of the medium/large-sized vehicles of about 20%. In the studies of travel time and speed, detector speed was reported to show the higher reliability in travel time estimation/prediction of expressways at a speed of over 70km/h(Oh et al., 2003), and average speed was reported to have the higher correlation with the speed on lane 2 than on lanes 3 and 4 in urban freeway(Kim and Jeong, 2012). So, this study is to investigate the lane traffic characteristics in the 8-lane expressways, identify the lane speed characteristics highly correlated with travel time reliability, and suggest the better correlation models for predicting planning time in the 8-lane expressways.
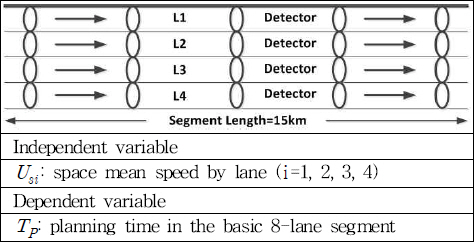
1.3 Data Collection
Study segments were selected from the basic 8-lane ones, as described in Table 1. So, data collection was repeatedly conducted from Jun. 16, 2014 to Jul. 6, 2014, and a master dataset for analysis was generated every 15 minutes in the basic 8-lane segments(i.e., lane 1 for passing vehicles, lane 2 for small-sized ones, lane 3 for medium-sized ones and lane 4 for large-sized ones for each direction).
Analysis of traffic characteristics
2.1 Flow
Flow was expressed by an hourly flow, as follows(TRB, 1975);
Where,
There seemed to be a distinct difference in flow rate between the directions as well as the lanes for each expressway as shown in Fig. 2. Also, average flow rate appeared to increase by about 9% to 27% in lanes 1 and 2 showing a higher deviation, but to decrease by about 4% to 31% in lanes 3 and 4 showing a lower deviation as summarized in Table 2.

2.2 Speed
Speed was converted into the space mean speed, as follows(May, 1990);
Where,
Us :
Space mean speed in segment(km/h)
n :
No. of stations in segment
Ni :
No. of vehicles observed at station i(veh)
Ui :
Spot mean speed at station i(km/h)
There did not seem to be a significant difference in speed between the directions but there was a distinct difference between the lane speeds for each expressway as shown in Fig. 3. Also, average speed appeared to decrease by about 6% to 17% in lanes 3 and 4 showing about 2.5km/h deviation, but to increase by about 5% to 18% in lanes 1 and 2 showing a higher deviation as summarized in Table 3.

2.3 Density
Density was estimated by the reciprocal of the distance headway, as follows(May, 1990);
Where,
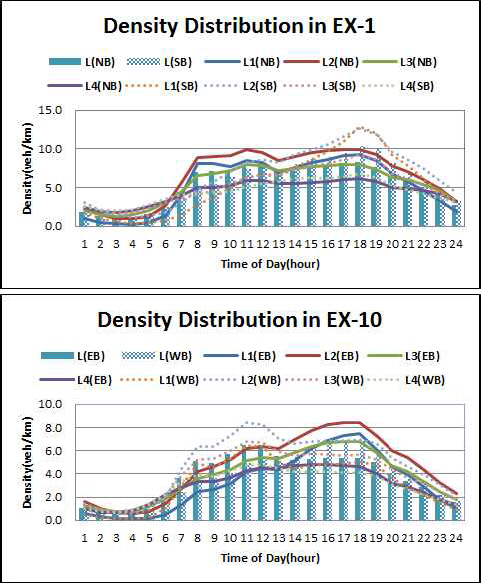
There seemed to be a distinct difference in density between the directions as well as the lanes for each expressway as shown in Fig. 4. Also, average density appeared to decrease by about 8% to 18% in lanes 1 and 4 showing about 2.3veh/km deviation, but to increase by about 3% to 23% in lanes 2 and 3 showing about 2.7veh/km deviation as summarized in Table 4.
2.4 Travel Time Reliability
Travel time reliability was estimated by the planning time (Tp) and buffer time(Tb), as follows(SHRP2, 2013);
Where,
Tp :
Planning time(sec)
Ur :
Regulatory speed(100km/h)
l :
Length of segment(15km)
U95 :
95th percentile speed(km/h)
Tb :
Buffer time(sec)
There did not seem to be a significant difference in travel time reliability(Tp and Tb) between the directions but there was a distinct difference between the actual travel times(Ta) as shown in Fig. 5. Also, average planning and buffer times in EX-1 appeared to increase by about 10sec and about 7sec, respectively when compared to EX-10 as summarized in Table 5. As a result, there was a need to review the correlation analysis between lane speed characteristics and travel time reliability, an inverse proportion to speed in expressways described in the above.

Correlation Analysis of Usi and TP
3.1 Correlation Analysis of Usi - TP in EX-1
Lane speed(Usi) and planning time(TP) in EX-1 appeared to have the negative linear relationship regardless of the direction as shown in Fig. 6.
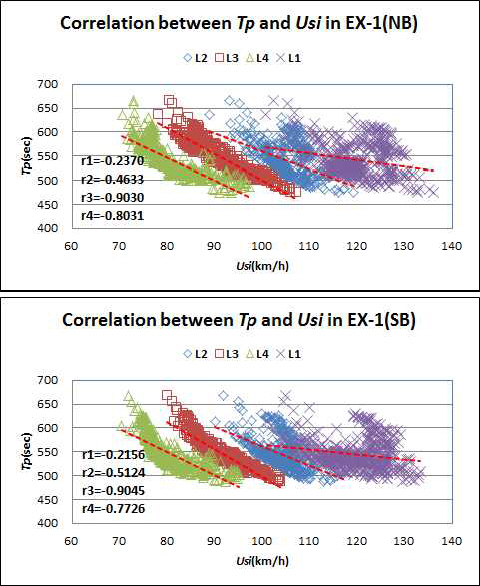
In particular there seemed to have the lowest correlation coefficients(r1) of -0.2370 and -0.2156 in lane 1, but the highest ones(r3) of -0.9030 and -0.9045 in lane 3 for the NB and SB directions in EX-1, respectively as summarized in Table 6.
3.2 Correlation Analysis of Usi-TP in EX-10
Lane speed(Usi) and planning time(TP) in EX-10(EB) also appeared to have the negative linear relationship regardless of the direction as shown in Fig. 7.
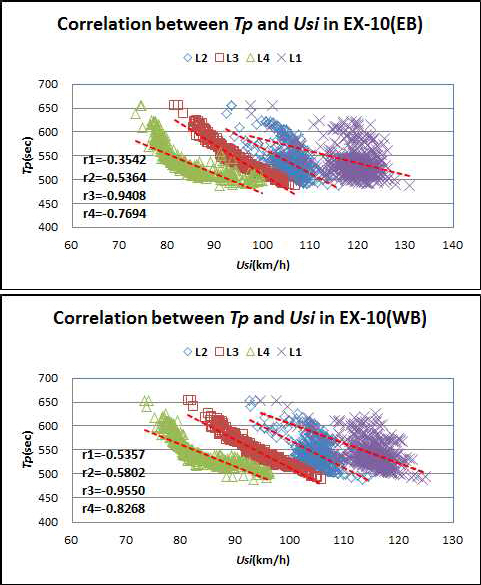
In particular there seemed to have the lowest correlation coefficients(r1) of -0.3542 and -0.5357 in lane 1, but the highest ones(r3) of -0.9480 and -0.9550 in lane 3 for the EB and WB directions in EX-10, respectively as summarized in Table 6. As a result, there was a need to consider the correlation model between the speed(Us3) in lane 3 and planning time(TP), because there showed the highest correlation coefficient(r3) regardless of the direction in expressways.
Model Development and Verification
4.1 Model Development
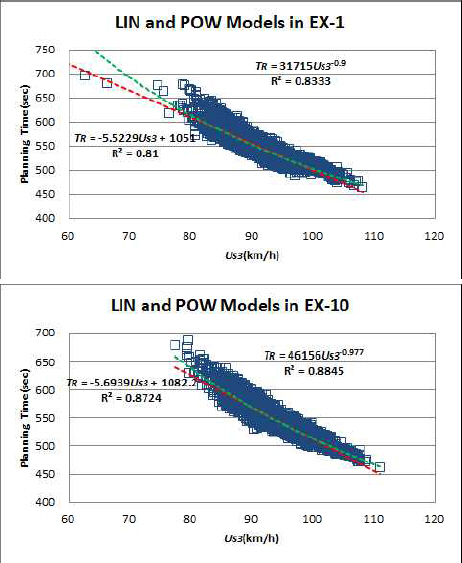
With the speed(Us3) on lane 3 in the basic 8-lane segments selected as an independent variable and the planning time(TP) selected as the dependent one as shown in Fig. 8, the correlation models(TP= f(Us3)) were suggested as follows;
Where,
A regression analysis was used to build the correlation models for predicting the planning time with the high explained variation of R2>0.81 as summarized in Table 7 and shown in Fig. 9. So, the most appropriate correlation models appeared to be the linear and power models in explanatory powers(R2) greater than 81% by the speed on lane 3 as summarized in Table 7.
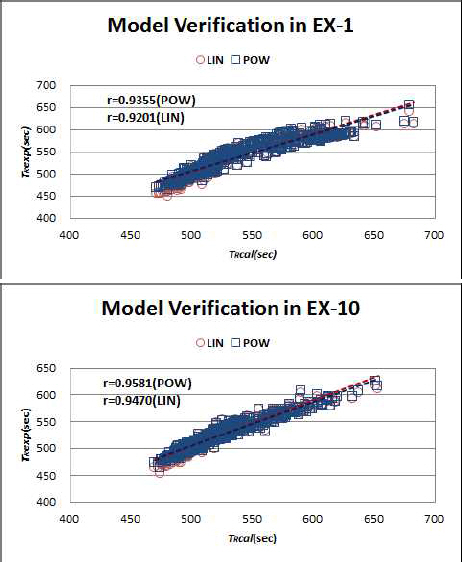
4.2 Model Verification
There were two approaches applied to ensure the validity of the models constructed. One approach was to conduct the paired t-tests between the observed and expected planning times, whether the p-values were greater than the significance level (╬▒/2=0.025) or not at the 95% confidence level.
In the paired t-tests, the computed values of t statistic appeared to fall inside the acceptance regions with the probabilities of 0.409 in the LIN and 0.117 in the POW of EX-1, and those of 0.160 in the LIN and 0.274 in the POW of EX-10, as summarized in Table 8. Other approach was to test the utility of the correlation models with traffic data unused. The test results(r) were shown to be 0.9201(LIN) and 0.9355(POW) in EX-1, and 0.9470(LIN) and 0.9581 (POW) in EX-10, as shown in Fig. 10. So, the power model proved to be more effective in predicting planning time in the 8-lane expressways.
4.3 Model Evaluation
Root mean square error(RMSE) statistics were applied to evaluate the measures of effectiveness(MOE) between the linear and power models by comparing the planning times. Particularly, there was a little less difference in the RMSE values of the power model than in those of the linear one, as summarized in Table 9.
So, the power model proved to have a little higher predictability than the linear one in the 8-lane expressways.
Conclusions
From the analyses and model development of the lane traffic characteristics in the Busan Ports-connected expressways, the following conclusions were drawn;
It was concluded that this study needed to be continued concerning the various geometric characteristics of expressways for the purpose of proving the reliability of the correlation model.
 PDF Links
 PubReader
 Full text via DOI
 Download Citation
 Print
Print


