

Introduction
The imbalance in dynamics between exports and imports, seasonal fluctuations, and the traffic congestion of empty or full containers are some of the most complex problems concerning global freight distribution (Rodrigue, 2017). The issue of empty containers positioning is underlined by the fact that about 8 trillion won (about US $ 6.7 billion) is spent annually for the relocation of empty containers around the world (Etnews, 2017). There are about 2.5 million TEUs of containers worldwide, being stored empty and, waiting to be used; therefore, empty containers account for about 20.5% of global port handling, and they are not always in the right place to be loaded with goods for next shipments (Rodrigue, 2017). The negative factors of the empty containers relocation is repeatedly discussed in South Korea (Park and Shin, 2009). These negative factors are especially apparent in the Gyeongin area (Shin et al.(2016), and can be seen as a hindrance for the truck transportation industry (Hahn and Park, 2012).
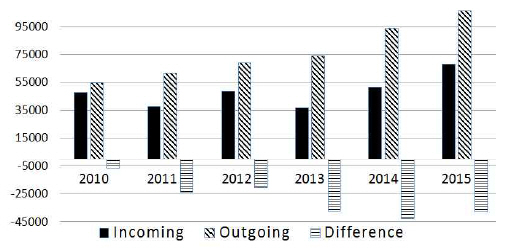
These same problems occurs within the Jeju - inland container shipping industry. The difference in volumes of incoming and outgoing freight (Fig. 1) causes the problem of container relocation. Moreover, for every 100 containers entering Jeju Island, 50% are usually empty, and about 3% are returned empty to the inland port. The necessity to rapidly change port technology to handle cargo more efficiently and productively is a primary concern of ports authority experts (Bandara et al., 2015). Efficient and cost-effective cargo management has become very important on Jeju Island, not in the least due to difficulties with managing growing freight volumes, traffic congestion, continuous population and tourism growth. This is the time when a new logistics policy is necessary. Some time ago, the government of South Korea announced the master plan of a new Jeju Island logistics policy and proposed the improvement plan for the regional logistics system to maintain consistency of logistics policy. This plan intends to change the industrial structure of Jeju. In addition, persistent problems such as the high-cost structure of Jeju logistics may be solved. The main goals of the project are to develop a more-efficient urban logistics and cooperation network, to spread standardization (such as container standards), and to build an eco-friendly logistics system. In October 2017, the Korean Ministry of Oceans and Fisheries approved the ŌĆ£Coastal Shipping Comprehensive Development StrategyŌĆØ to solve the coastal shipping sector problems under the vision of "environmental friendly coastal shipping that protects the national economy and maritime territory".
Fig.┬Ā1
Container volume of Jeju Island port
Unit: TEU (two 8 ft. containers were taken for 1TEU)
Source: SP-IDC Shipping Port Logistics Information System (www.spidc.go.kr)
Many recent works (see the literature review) reveal that collapsible or foldable containers may be an innovative solution to many issues in the shipping industry.
This technology possesses the following advantages (Holland Container Innovations, 2018):
collapsible factor radically reduces the volume of empty containers being shipped;
higher capacity of laden containers (or other cargo) on a vessel;
reduction of repositioning and handling movements as well as its costs;
reduction of time vessels load or unload containers at a terminal;
reduction of port congestion;
terminals and yards suffer less from space shortage;
lower fuel consumption and lower CO2 emission levels.
The foldable containers secure economic efficiency by 20% more than standard container in domestic logistics (MOLIT, 2017). The technology is expected to reduce container transportation costs of around 6 trillion won per year worldwide and 300 billion won per year domestically.
The concept is not new. Since the late 1990s, in Europe, several foldable container models were experimented with, but failed, mainly because of the extra operations involved in folding and unfolding them. There was one more drawback - the price of a foldable container was much higher than that of its standard counterpart.
Nowadays, there are many patents related to foldable containers in China as well as in Korea. The Korea Railroad Research Institute has developed its own folding container technology and plans to commercialize it by 2021. According to the institute, improved containers can be folded by two people within 10 minutes to become a quarter size of a standard container, while previously developed technology required five or six people.
Considering all of the advantages that foldable container technology offers, it should be advisable to analyse and evaluate the potential application of foldable containers for Jeju - Mokpo container route (JMCR). The major purpose of the current research is to discuss the conditions required for successful commercialization of such containers on the basis of executed analysis. This paper uses cost-effective analyses, sensitivity analysis methods, and real freight volume data.
Literature Review
In the past, many companies around the world have proposed various designs of folding containers. The ŌĆ£Six-in-One (SIO)ŌĆØ containers launched by Swiss based SIO Container Company, the ŌĆ£FallpacŌĆØ containers manufactured by Swedish Fallpac AB and ŌĆ£HCIŌĆØ containers (Holland Container Innovations) were studied thoroughly.
Konings (2005) examined the commercial potential of ŌĆ£SIOŌĆØ and ŌĆ£FallpacŌĆØ containers and showed that, in spite of substantial gains of foldable containers, potential costs and benefits highly depend on the currently applied logistic concept and additional expenses. Shintani et al. (2010) analysed the opportunity to cut down expenses for repositioning empty containers through the use of ŌĆ£HCIŌĆØ foldable container. The research showed that the economy of foldable containers depends on surplus and shortage situations in a hinterland where empty containers are distributed. Moon et al. (2013) analysed the opportunities for the above mentioned types of foldable containers, comparing the repositioning costs of foldable containers to those of standard containers. The results showed that a decrease in production cost of foldable containers and an increase in transportation costs have a strong impact upon foldable containers usage, and improving the design of foldable containers reduce their price.
In our paper, we consider the case of an 8 foot foldable container. In Fig.2 there is an example, the 8 foot foldable container, made by Vanplus Corporation and Korea Pallet Pool Co., Ltd. was patented and published in 2014.
Fig.┬Ā2
Folding method for an 8 foot empty container
Source: Google Patents, Patent #WO2014109446 A1

According to the invention, the front, rear and side wall bodies are folded inwards and the roof is lowered, and thus the front, rear and side wall bodies can be compactly accommodated in a space between the roof and the base without remaining space. The foldable container can be folded by a simple auxiliary device. Such equipment operates remotely, it is easy to use in the field regardless of the skill of the operator.
Analysis and Findings
3.1 The Port of Jeju Island and the Port of Mokpo
Jeju Island lies in Korea straight; Mokpo lies in the southwest of Jeollanam-do province. The distance from the northernmost point of Jeju to Mokpo is 178 km.
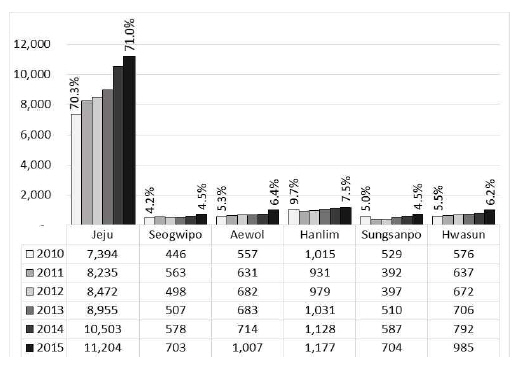
On Jeju Island, there are six ports: Jeju, Sungsanpo, Seogwipo, Hwasun, Hanlim and Aewol. The port of Jeju handles about 71% of total port handling volume (Fig. 3). Throughout this paper we are speaking of JMCR, referring to the port of Jeju.
Fig.┬Ā3
Fig. 3 Ports turnover volume
Units: Thousand ton, percent (share)
Source: Jeju Logistics master plan (2016)
The port of Jeju is measured at 20 berths with a total area of about 3,771 m┬▓ and the length of the quay wall is 3,518 m., its open-storage area is 114 thousand m┬▓, and its cargo handling capacity is 13,456 thousand R/T per year.
The port of Mokpo is measured at 27 berths with a total area of about 41,300 m┬▓ and the length of the quay wall is 5,149 m., its open-storage area is 568 thousand m┬▓, its cargo handling capacity is 2,632 thousand R/T per year.
Sea and air are the only transport modes for Jeju Island; therefore, the logistics cost between itself and mainland South Korea are relatively high. By sea, Jeju is connected with Mokpo, Busan, Incheon, Pyeongtaek-Dangjin and other ports. Table 1 summarizes the traffic outbound Jeju Island.

The JMCR reaches up to 62% (690.8 thousand tons) of the Jeju-mainland freight turnover volume in 2015.
Table 2 shows shipping routes between ports.

The shipping routes were designed to serve the Jeju local manufacturers of bottled mineral water (JEJU Lava Water; Samdasoo), agricultural products and other goods.
The K Line was the first type of cargo ship to be introduced in Jeju as Container (LO-LO) & Vehicle Carrier (RO-RO) that can receive cars and be loaded with containers simultaneously. The tonnage is the largest among cargo ships registered on Jeju.
International standard containers (20 ft. and 40 ft.) are not common in the Jeju area, instead, smaller non-standardized containers are widely used - about 80% of them are 8 foot containers.
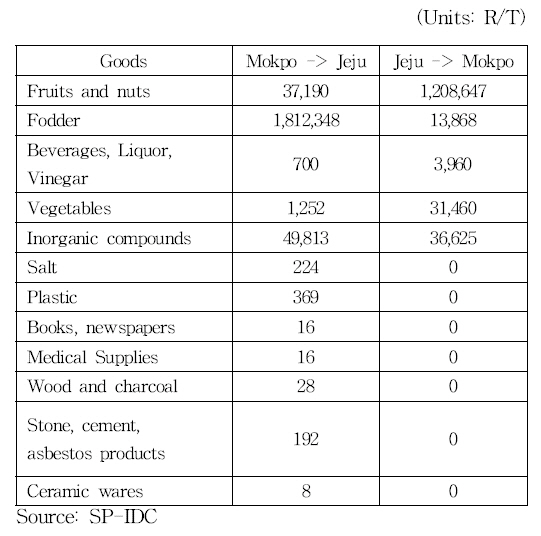
Table 3 presents the usual cargo types shipped in containers between Jeju and Mokpo - mostly fruits, fodder, inorganic compounds, and vegetables.
3.2 Jeju - Mokpo Container Route cost-effective analysis
For the purposes of this paper, we made the assumption that four empty foldable 8 ft. containers can be bundled into a stacked unit, which equals in size to one 8 ft. standard container.
On the basis of the number of links in the logistics chain, the port-to-port concept was employed. The transportation by Jeju - Mokpo - Jeju (or Mokpo - Jeju - Mokpo) container route is assumed to be a one-cycle route; the Jeju - Mokpo (or Mokpo - Jeju) route is a one-way route. The one-cycle route:
the duration of sea journey is one day;
the duration of land stage is 14 days total in both directions and it includes periods of stay at terminals and in depots;
the average duration of an empty containerŌĆÖs stay in a depot in one-cycle route is 10 days.
one-cycle route reaches 15 days and there are 2 cycles in one month.

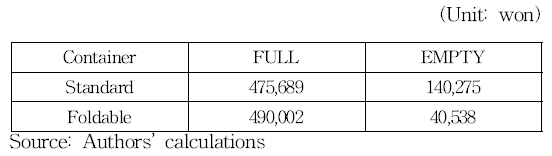
It was also assumed that containers were purchased. The price of a standard and a foldable container is 1,500,000 won and 3,000,000 won, respectively.
The fees for activities was set for one 8 ft. container and in terms of laden or empty container may vary.
All these assumptions, as well as fees and records from following tables, were made in conformity with the data received from Korea Container Pool Co., Ltd.
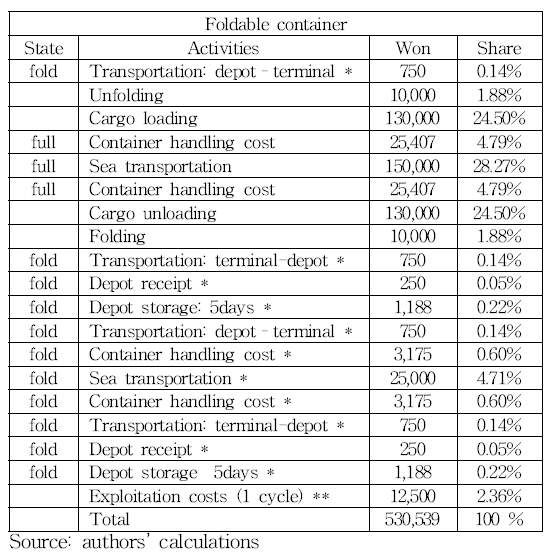
In Table 4 and Table 5 one-cycle route costs, split up into activities, are shown. In this case, loaded containers go from one port to another, but on the way back - they are empty. Additionally, it is assumed that foldable containers are being folded and unfolded in a terminal. 1,500,00 / 10 years / 12 month = 12,500won per month, there are two cycles in one month - 6,250won per one cycle.
The share of movement costs of empty containers in total chain costs is 24.17%. The most expensive activity of an empty container handling is sea transportation - 16.23% of total chain costs.
Table 5 shows that costs for sea transportation of an empty container can be decreased notably, from 16.23% of total chain cost to just 4.32%. The share of folding/unfolding fee in total chain costs is 3.77%. The share of a standard container exploitation costs in the total chain is 1.01%; in the case of foldable containers, the share is 2.36%.
The potential chain savings in this concept are 85,425 won per one cycle for one container.
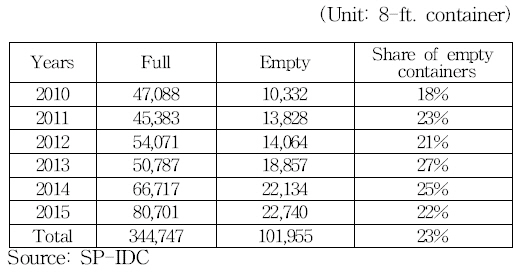
According to Table 6, in 2010-2015, there were 101,955 empty containers on JMCR. So, the chain savings in 2010 could be 883 million won; in 2011 - 1.181 billion won; in 2012 - 1.201 billion won; in 2013 - 1.611 billion won; in 2014 - 1.891 billion won; in 2015 - 1.943 billion won.
Table┬Ā6
Jeju - Mokpo Container Traffic (consolidated), in 2010 - 2015 years (Unit: 8-ft. container)
|
Table 6 clearly shows that the quantity of containers is growing over the years. The JMCR is obviously actively developing and in demand. Along with the increase of container traffic, the number of empty containers increases as well. However, the share of empty containers remains almost the same (23% on the average).
In Table 7 we can notice a remarkable full/empty container imbalance. There are only few outgoing empty containers from Jeju (3% at average), most of the containers leaving Jeju were loaded. Many more (42% on average) empty containers come from Mokpo. So, it leads us to another angle on chain cost - Table 8 shows the one-way cost of a single container.
Table┬Ā7
Jeju and Mokpo Container Traffic (by directions), 2010 - 2015 years (Unit: 8-foot container)

|
The one-way route is the Jeju - Mokpo (or Mokpo - Jeju) route; it is half of a one-cycle route and consists of the following activities step by step, but varies in term of laden or empty containers, standard or foldable containers: ŌĆ£Transportation: depot-terminalŌĆØ, ŌĆ£Unfold containerŌĆØ*, ŌĆ£Cargo loadingŌĆØ**, ŌĆ£Container handling costŌĆØ, ŌĆ£Sea transportationŌĆØ, ŌĆ£Container handling costŌĆØ, ŌĆ£Cargo unloadingŌĆØ**, ŌĆ£Fold containerŌĆØ*, ŌĆ£Transportation: terminal-depotŌĆØ, ŌĆ£Depot receiptŌĆØ, ŌĆ£Depot storage 5daysŌĆØ, ŌĆ£Exploitation costs 1/2 of cycleŌĆØ. The unfold/ fold container fee was omitted for standard containers. The cargo loading/unloading fee was omitted for empty containers.
Hence, in the case of a ŌĆ£FULL<->EMPTYŌĆØ route in which full containers go from one port to another, and return empty, a foldable container provides a more cost-efficient return journey. On the contrary, the case of a ŌĆ£FULL<->FULLŌĆØ route in which the full containers on a round trip, can lead to additional expenses.
The benefits from foldable containers can be calculated by years and by directions (Table 9). In this table, we assumed that if 100% of all containers on the JMCR were foldable.

As discussed above, the benefits on Jeju - Mokpo route cannot be achieved, because most of the containers are being shipped full. Notwithstanding, the benefits for the opposite direction (Mokpo - Jeju) are substantial enough to cover the losses. Thus, the chain savings could be: in 2010 - 356,512,140 won; in 2011 - 729,596,357 won; in 2012 - 628,782,945 won; in 2013 - 1,153,826,278 won; in 2014 - 1,252,658,337 won; in 2015 - 1,112,945,967 won.
Optionally, the seasonal fluctuation can be examined on Fig. 4. We assumed that foldable containers are valid when the average number of empty containers on route exceeds 500 units per month (Table 10).
Fig.┬Ā4
Number of empty containers on Mokpo - Jeju direction
Unit: 8 ft. container
Source: AuthorsŌĆÖ calculation


For other months, standard containers are more preferable due to the number of empty containers being minimal.
The seasonal pattern suggests that from January till March and from September till December - 100% of all containers must be foldable. From April till August - 100% of all containers must be standard.
The abovementioned pattern could have reduced the annual costs of the supply chain by 2.2% in 2010, 3.5% in 2011, 2.6% in 2012, 4.7% in 2013, 4% in 2014 and 3.3% in 20151). The total annual cost for all cases is given in Table 11.

Table 11 also shows the amount of savings from the seasonal usage of foldable containers: 517 million won in 2010; 830 million won in 2011; 713 million won in 2012; 1.260 billion won in 2013; 1.397 billion won in 2014 and 1.376 billion won in 2015.
The seasonal pattern could have saved additional 160 million won in 2010; 100 million won in 2011; 84 million won in 2012; 106 million won in 2013; 144 million won in 2014 and 263 million won in 2015.
Considering the aforementioned, it was decided to analyze a mixed percentage of foldable and standard containers on the route. Following from the number of empty containers on the route and taking into account the seasonality pattern, we assume the percentage of foldable containers in Table 12.

All of the received data was summarized in Table 13. If we compare the amount of total annual cost and the amount of savings in the case of a mixed container pool with seasonal patterns included, against 100% foldable or 100% standard container pools, more positive results can be achieved.
Table┬Ā13
Costs and benefits of mixed percentage of foldable and standard containers on the route, considering the seasonality. (Unit: million won)

|
A mixed percentage of foldable and standard containers would allow us to reduce the annual cost of the supply chain by 3.4% in 2010, 4.5% in 2011, 3.8% in 2012, 4.8% in 2013, 4.5% in 2014 and 3.4% in 2015 2).
The current analysis may be extended by a sensitivity analysis; it allows us to explore the impact of uncertainty on our findings. This sort of consideration is found to be reasonably valid for studying how measured quantities vary when our modelŌĆÖs parameters are varied within a specified range.
First, we define a parameter to vary: exploitation cost (1) of a foldable container; folding/unfolding charge (2), and empty container share (3) - Fig. 5. The range of values, within which the parameters will vary: increase by 50%, decrease by 50%.

The results show that the benefits from using foldable containers actually depend on variation of these parameters. The most sensitive variation is ŌĆ£empty container sharesŌĆØ (3). In the case of a significant decrease of this parameterŌĆÖs value, the benefits from using foldable containers will disappear. Changes in the folding/unfolding charge (2), undoubtedly, give significant effects. The benefits from foldable containers usage depend on all types of additional costs, including the abovementioned parameters. Additional costs should be reasonable enough so that the benefit can cover them. As for the exploitation cost (1), when foldable containers are produced on a larger scale, their purchasing price should decrease substantially.
Summary and Conclusions
The aim of this research was to estimate the costs, benefits, and effectiveness from the application of 8 foot collapsible containers on the Jeju - Mokpo container route. The initial findings show that transportation costs of empty containers may be decreased notably, from 16.23% of the total chain cost to 4.32%, and potential chain savings may reach 85,425 won per cycle for every single container.
The examination of real route figures in the 2010 - 2015 period indicates a continuous increase of container traffic along with an increase in numbers of empty containers, and the share of empty containers is about 23% at the average.
Meanwhile, most of the containers that travel from Jeju to Mokpo are fully loaded and 58% of all returning containers are also full. So, foldable containers cannot be folded. Hence, the benefits on the Jeju Island - Mokpo line cannot be achieved; in this case, additional exploitation costs of foldable containers cannot be covered.
Nevertheless, the benefits of using foldable containers on the Mokpo - Jeju route were numerous enough to cover the losses. The share of empty containers on this route was 42% on average.
Thus, the amount of savings from using foldable containers could have reached 1,253 million won annually. Additionally, seasonal patterns and mixed percentages of foldable and standard containers give the opportunities for cost-effective solutions. This could have reduced the annual cost of supply chain by 4.8% or up to 1.846 billion won annually.
All these findings were supported by a sensitivity analysis. In the case of a significant increase in the number of loaded containers on the route - in accordance with the purpose of shipping -it would question the expediency of foldable containers application, as their benefits will be erased. On the other hand, an increase in the number of empty containers can be achieved by the inclusion of 8 foot foldable containers in other supply chains (from other inland parts of the country to Jeju island), as well as other means of transportation (sea, land, multimodal). It will increase the applicability of foldable containers, which in turn will decrease the costs. As for the extension of the paper, this suggests a possible direction for further research.
Furthermore, it is important to note the peculiarities of the Jeju - Mokpo route, which complicate the implementation of 8 foot foldable containers.
Some cargo requires special conditions of temperature, humidity, air tightness and so on. This may increase the costs of foldable container technology. However, nowadays there are no special or refrigerated 8 ft. containers on the JMCR.
The 8 foot container is not popular on international trade routes. This may preclude them from relocation.
Bulk cargo and cargo, delivered by box-trucks are quite widespread. Although, a niche for 8 foot containers could be found on semi-trailers.
There are container standards issues in Korean domestic transportation. The existing logistics structure includes 8 foot, 10 foot and 12 foot containers. The unification of container sizes should be considered.
Moreover, foldable containers may require additional mechanisms and labour force for operation and maintenance. Although, the technologies improved over the years and new patents may take the edge off these problems.
On the other hand, this paper does not consider such issues as land value. Folded containers need much less storage space - this fact can reduce the necessary depot areas, which would make entire terminals more compact. Meanwhile, the 3rd National Port Revision Plan (2016 - 2020) proposed a modernization of partner ports to revitalize coastal transportation. In addition, this paper does not consider the environmental dimension; even though the vision of an "environmentally-friendly coastal shipping which protects the national economy and maritime territory" has been announced by the Korean Ministry of Oceans and Fisheries. Hence, we believe that the application of foldable containers into practice will be in accordance government plans and interests. At the same time, measures such as tax deduction, government subsidies, concessional lending and business-friendly policy can promote the use of foldable containers.
In general, the potential of foldable containers can improve trade routesŌĆÖ operational efficiency and create new useful logistic models for the Jeju Island - Mokpo container route. However, there are numerous obstacles to overcome before foldable containers will have a deep involvement in the logistics industry.
 PDF Links
 PubReader
 Full text via DOI
 Download Citation
 Print
Print


