A Study on the Policy Priorities for the Enhancement of the Trans-shipment Competitiveness of the Port of Busan
Article information
Abstract
This paper intends to evaluate the policies which are considered necessary to enhance the T/S competitiveness of Busan’s port, and thereby present suggestions to the government which would best implement the results of this research. This research first raises the claim that the majority of the following four conditions: location of the port, port productivity/service level, status of network with overseas ports, and cost competitiveness, should be satisfied in order to maintain a competitive T/S port. Based on these four conditions, seven policies, which are individually pertinent to the four conditions, have been drawn up for proposal, and they are also analyzed in the survey, where all the eligible samples participate to ensure if they are effective in enhancing the T/S competitiveness of Busan. Proposed important policies are a) Terminal operator integration, b) port infrastructure expansion, c) global carriers owned terminal operation, d) enhancement of national carrier’s competitiveness, e) feeder carriers’ owned terminal operation in new port, f) institutional support for effective and convenient environments for handling T/S cargo, and g) volume incentive expansion. From the analysis by which all the relevant parties (Carriers, Terminal Operators, Port Authority) are answered, it was found that all the seven policies have relevance in strengthening the transshipment competitiveness of Busan’s port. Whereas in the analysis that uses AHP methodology to compare the significance among the different policies, it was found that terminal operator integration has the highest priority in terms of increasing transshipment competitiveness.
1. Introduction
Transshipment cargo inherently has different characteristics from the gateway cargo (import & export cargo). First of all, in the perspective of revenue, difference is remarkably seen at the aspect of economic effect it brings about. In case of gateway cargo the revenue from handling it in the port finally returns to the logistics costs of national export/import companies, thus, if taking macro view on the economic effect of national level, the outputs a port yields has virtually no added value. On the other hand, in case of T/S cargo, the revenue comes from the international companies’ pockets, hence, the revenue contribution to national economy of it can be of importance. Secondly, difference also can be found in the capability to increase volume of the port. The container volume of the port is strongly linked to the economic situation of the nation, therefore, if national economic growth stays at a low level, growth of container volume can not be expected either. However, T/S cargo is not related to the economic situation of own country, therefore, container volume can be increased, in spite of national economic situation, only if port can accommodate good environment for T/S by taking advantage of resources a port holds.
In general, container throughput in the emerging countries where manufacturing consumer goods occupies a major sector in economy doubles GDP growth, whereas in the advanced countries it goes abreast similar rate of GDP growth, because in case of advanced countries they largely gain the growth of economy from the service, financing sectors, which entails weak physical transportation of container freights inter-countries. Korea has achieved very rapid economic growth by manufacturing and exporting quality goods, and this made lots of contributions for the growth of the domestic logistics industries. However, with the change of industrial structure into the type of advanced country and relocation of manufacturing factories to China and Southeast Asian countries having labor cost advantage, driving force of sustainable growth in Busan port dwindles, and this trend will not be changed for a long while. This clearly indicates that Busan port has to focus on the T/S cargo in order to attain the development of the port industry. In spite of such advantages as aforementioned however, not every port can be grown up with T/S cargo, but instead, several conditions, as T/S port, should be satisfied matching carriers’ selection of T/S port standard. Carriers, in general, consider Location of the port, Network availability with overseas ports, Level of port service and productivity and Cost competitiveness when appointing the T/S port to optimize the resources in the levels of Cost and Time. Busan Port Authority (BPA) have been enacting diverse policies in order to attract more T/S cargoes, for instances, by giving incentives, easing the restrictions and strengthening target marketing to major global shipping companies.
Therefore, this research intends to find which actions should be necessary in order to enhance the competitiveness of Busan port as a T/S port and analyze the priority of raised policies from the users’ eyes, which may ensure accuracy of the analysis. As the methodology in deciding the importance and priority among 7 factors to be analyzed and evaluated, AHP analysis - which is commonly used when compare and digitize the comparative importance - is supported.
2. Theoretical backgrounds and Preceding Research
2.1 Factors deciding T/S competitiveness
2.1.1 Geographic factor
Busan port has very high geographic relevance with global economic countries, America, China and Japan. Busan is the nearest Asian port crossing Pacific ocean from America, and centered between China and Japan. With the highly developed network, Busan Port is connecting them efficiently. It is very certain that carriers take the location of the port into highest consideration when fixing the T/S port because the transit time for delivery should be shortened by connecting origin and destination of the cargo in the shortest time. Among several factors, which decide the T/S port, Location of the port is an unchangeable factor while the other factors can be improved through the efforts, and this implicates that Busan port has to focus mroe on the strategy to grow as a T/S port. In terms of Location of the port, the existence of the competing ports also matters together with the distance, which enables to connect the ports in short distance. For instances, Singapore forms the competitive composition with Tanjung Pelepes, Hongkong does with Guangzhou and Shenzhen while Busan also does with Shanghai, Ningbo and Qingdao. Singapore, Hongkong and Busan, which have long enjoyed as unrivaled central ports now have to prepare for avoiding cargo leakage to proximate competing ports who are expanding port scales to attract more cargo from neighboring ports. In order to maximize the competitiveness in location, port should be located on the main trunk routes and distant from competing ports, however, it is not easy to find the ports possessing both the conditions.
2.1.2 Network factor
To a T/S port network with overseas ports is a very critical point. Whereas Network means carrier’s established service routes to destinations.
As above, Table 1 indicates that Busan has very high connectivity in the regions of America, China, Japan and SE Asia. In general, Network is spontaneously established by the carriers while considering the cargo volume for them to capture, and Port Authority’s endeavors to promote vessel calling by offering incentives to carriers can also contribute to network expansion. On the other hand, the deterioration of the network comes from several reasons such as carrier’s service rationalization, worsening of service circumstance, but, the most persuasive reason is the shrinkage of market. Therefore, the port has to expand the network by providing appropriate business environments to carriers and take proper policies at which carriers accept as attractive

Weekly service status in Busan Port (2019)
2.1.3 Productivity and Service factors
Port productivity is shown as the cargo volume a terminal handles at the berth for an hour and this directly affects the ship’s port time.
There are two methods in improving productivity of a terminal: additional deployment of cargo handling equipment and improvement of efficiency of individual equipment. Terminal operators are cautious to invest in equipment because it entails large CAPEX issues, instead, they tend to upgrade efficiencies by adopting IT supported operation systems 1),.

Port facility and capacity in Busan Port(2019)
As of 2019, the quantity of quay cranes in Busan port is 118 units, in Old port and New port all together having 17 berths and 21 berths each. Unit quantity per berth, whereas, is around 3 and this falls short of average global major ports having around 4. The high productivity generally comes from harmonious operation of all cargo handling equipment, short dwelling time of container, moderate turn around time of road tractor and general control system inside terminal. High productivity enables ships to depart after cargo handling and this directly affects on the ship’s bunker consumption, Therefore, shipping companies highly weigh and compare the level of productivity when they go into contracts with terminal operators.
Meanwhile the Port service comprises many comprehensive factors in the terminal, for example, Weather condition, Labor relationship, Port infrastructure, Port Authority’s policy direction and Convenience in managing T/S cargo in the port, which in general implies Non-Cost factors affecting on the cost indirectly. Among these factors, the level of port infrastructure and Port Authority’s policy stances, which may ensure smooth T/S cargo handling in the port are regarded as important factors. Port Infrastructure, mainly having relationship with vessel operation, helps vessels to have convenience of access to port and enables vessels to berth whenever vessels arrive without waiting out of the terminal. Port Authority’s policy direction, on the other hand, mainly having relationship with general administration of port, directs convenience in handling T/S cargo in the port. Offering incentives to vessel and T/S cargo also includes Long-termed port management vision.
2.1.4 Cost Competitiveness factor
Below Fig.1 shows the container shipping company’s total costs breakdown incurred in the port. As indicated clearly, terminal cost occurred from cargo handling inside terminal, by claiming 32% of whole costs of the company, occupies the highest portion among all the cost items.
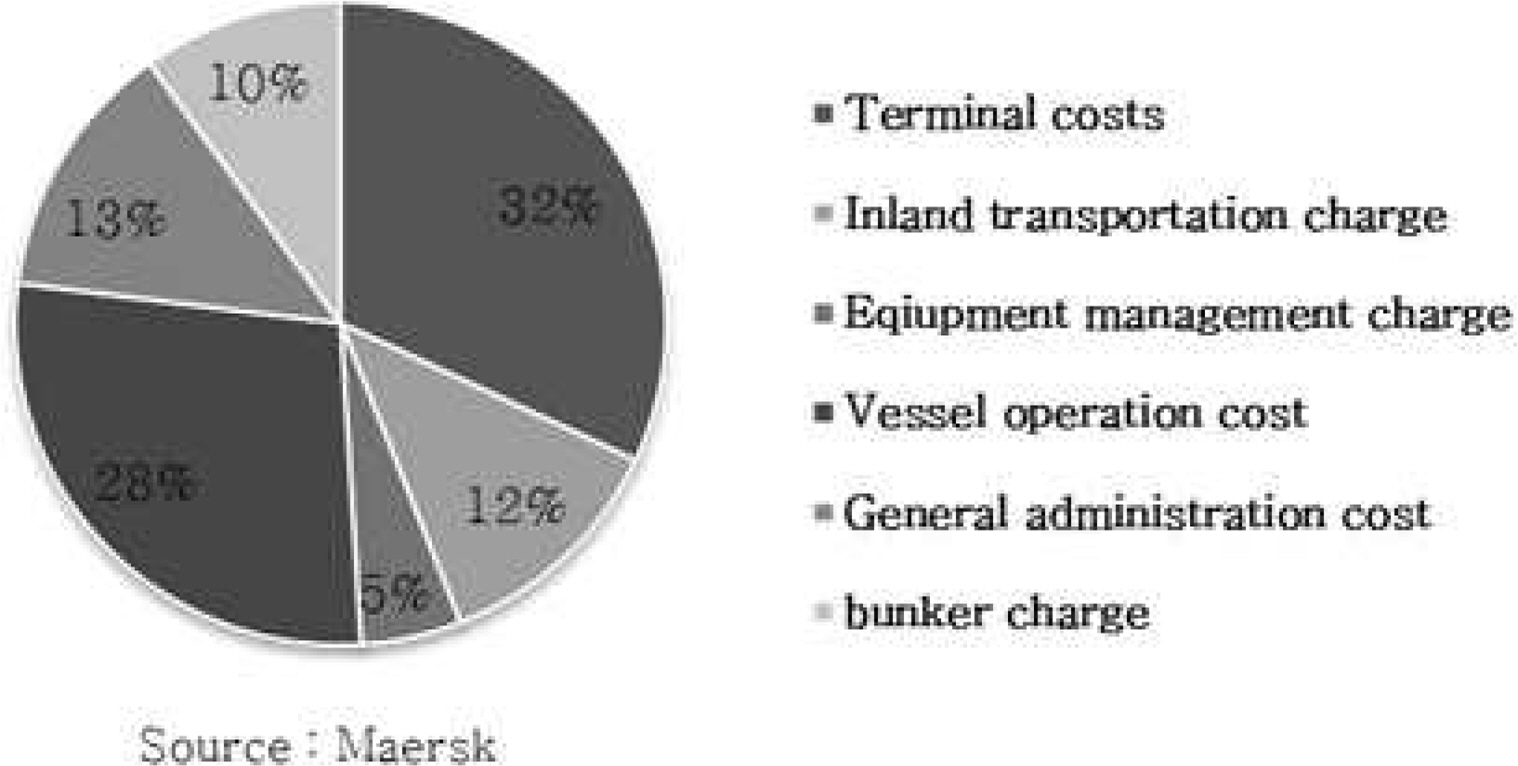
Cost proportion of carrier(Maersk)
Terminal handling charge has two types in the process of formation. Public Tariff system, as the first, imposes the identical schedules of rates and all the contract parties have to observe the published guidelines. Individual Contract Tariff system, as the second and mostly common in the industries, imposes the contract rate, which is fixed through the negotiations between terminal operator and shipping company2). In general, Contract rate system is a prevailing practice and the level of rate is decided by the balance of negotiation power, which in most cases are heavily affected by the factors of demand (cargo volume) and supply (port facility) at the same time. In the meantime, there can be differences in the level of tariff depending on the types of operators. It is generally observed that the highest level is seen at the Carrier Operating terminal, then, at the GTO (Global Terminal Operator) and finally at the Local terminal operating terminal in the order of rate level.
Below Fig. 2 shows the Terminal Handling Charge level of Busan by comparison with major ports in China and Japan. As indicated, level of Busan contrasts with Chinese ports having narrowly higher level, however, shows much lower level than Japanese port. As main issue moderately related to the T/S competitiveness of Busan, very importantly, the tariff rate level in T/S cargo in the comparison between Busan and Chinese ports, Busan around doubles than Chinese ports while around by 30% lower in Local (Export/Import) cargo. The considerable difference of rate in T/S cargo between Busan and Chinese ports may be interpreted by the structure of cargo in the ports. The portion of T/S cargo in most of the Chinese ports remain around 5% more or less, in comparison with Busan having around 53% as of 2020. This present situation having a big difference in the volume of T/S cargo gives high flexibilities to Chinese port in attracting T/S cargo supported from the low T/S portion, which is not enough to affect the outputs of revenue in terminal operation. Whereas Busan has very limited rooms in cost competition with Chinese ports by lowering the rate to match level of Chinese ports. Simply, to have cost competitiveness, Busan has to raise rate level of Local cargo, but, lower the rate level of T/S cargo. However, without Port Authority’s proactive intervention to rectify current rate structure, the restructuring of rate in Busan is hardly achievable, and furthermore, practically it is impossible for the Port Authority to jump into the market operation. This implicates that Busan has to compete with Chinese ports, in order to maintain T/S competitiveness, in non-cost sector by offsetting the inferiority in the cost.
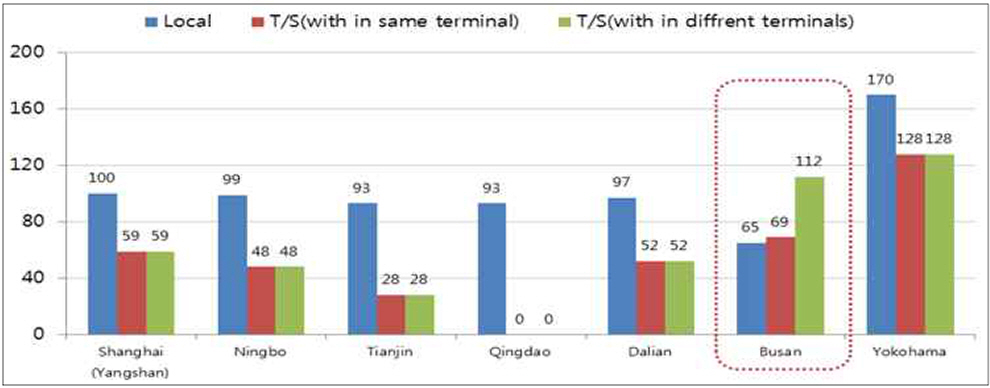
Terminal Handling Charge Comparison among major ports
Source : Busan Port Authority, Busan Port Operational plan 2018
2.2. Recommendation of Policies to enhance T/S Competitiveness
2.2.1 Geographic Viewpoint and Network Viewpoint
As aforementioned, Busan has a high geographical relevance to that of America, China and Japan. Busan port’s such outstanding relevance with global economic powers clearly indicates that Busan port has to seek for the driving force of growth from the T/S cargo by making use of geographical merits. As of 2019, the portion of T/S cargo in Busan, as shown on Table. 3 , amounts to 53% and Busan Port has a plan on 2030 vision to increase T/S cargo portion up to 60%.
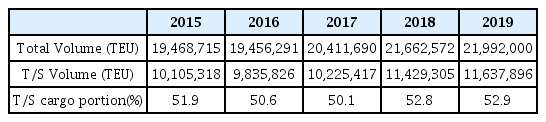
Busan Port T/S cargo Proportion
From the Table 4 below, it is found that all the T/S ports are located on the main trunk routes connecting global trade centers in continents. Along with the locational characteristics, remarkable point of common features is that global mega carriers are actively participating at the terminal operation as the Operator. Busan and Dubai, whereas, are exceptional cases, but, Dubai has the exclusive operation system by Global Terminal Operator, Dubai Port World, which provides an excellent ground for consistent policy integrity. In case of Busan, HMM is jointly participating in terminal operation with PSA in New port, however, Global mega carriers are not operating own terminal.

Top 10 world Transshipment ports(2019)
Shipping companies prefer direct service patterns without T/S for providing faster service to customers and saving the costs in T/S processes. However, with the limited service resources and non-coverage of all the destinations, transshipment of cargo unavoidably occurs. When shipping companies select T/S ports, they tend to choose the last port to the destination bound and first port from the origin if those ports are qualified enough to provide the reasonable service to carriers. For instances, in the transportation from Asia to USA and vise versa, Busan is the last port in Asia to USA and the first port from the USA, and this explains Busan has the strongest competitiveness in this region. Whereas, Singapore has the same characteristics as Busan in the service scope between Asia-Europe regions. Together with the regional factors, to back up the locational distinctions, sufficient network in the port should be supported as well essentially. Traditionally, “Hub and Spoke” was the prevailing concept by which transshipment of cargo is carried out between mother vessel and small sized feeder vessel. However, with the newly organized alliance system among the mega carriers and augmented vessel capacity therefrom, T/S mode is shifted to “InterSection T/S” which means T/S is carried out between the big ships. What this implicates is that T/S ports has to offer carriers enough size of berth capability.
Below Table 5 shows the T/S volume between Busan and other countries. Because of geographic merits of Busan, Global 1,2,3 shares about 62% of entire T/S volume of Busan and Intra-Asia carriers play an important role by connecting between Large vessel from/to America and feeder vessel from/to China, Japan with excellent feeder network.
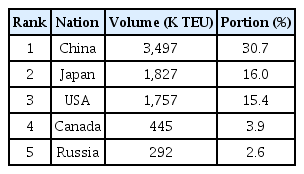
T/S cargo flow by nation-wide (2019)
According to the examination over network comparison among major ports carried out in 2019, Busan was investigated to stand at the 2nd position in weekly service operations only after Singapore. However, closely looking at the nationwide coverage, about 60% of routes is are heavily distributed in near sea areas, Japan, China and South East Asian countries. This status quo, of course, is originated from the geographical situation with Japan and China and industrial structure outsourced to South East Asian countries. In terms of T/S point of view, however, most of the carriers covering these areas are using the Old port, then, connected to the vessel calling New Port to go to distant nations, America, Europe while bringing about costly transportation inter terminals between Old port and New port. Because of geographical condition of Busan, this kind of pattern will last long until the closure of the Old port, therefore, it is necessary as temporal solution, to induce feeder carriers serving near sea areas into New port. In inducing them to the New port, current terminal operator in New port have to reserve the facilities for them to connect ship-to-ship within the same terminal, however, New port operators are reluctant to receiving feeder vessels because of comparatively low handling rate and poor productivity.
2.2.2 Port productivity and Service viewpoints
Port Productivity directly affects the vessel’s port time, thus, it comes up as very important agenda between the carrier and terminal operator when they negotiate for service contract. Productivity is calculated simply by counting the number of container boxes each berth handles for an hour. Of course, when a terminal deploys more cranes in loading and discharging the cargo, it yields higher productivity, therefore, more cranes and more resources together with harmonious operation of equipment inside terminal is the key to maintaining higher productivity. However, excessive CAPEX expansion gives the terminal operator an expense burden, therefore, terminal operator takes discrete stance in the management of equipment and human resource. It is not common practice yet in the industry, however, sharing the laborer, equipment and facilities when available, among terminal operators can possibly give solution for this issue.
According to the data evaluated and released by Korea Maritime Institute, having 1,500 terminals in 600 ports as samples, productivity of Busan port in 2019 was counted as 89.6 which is 4.3% lower than in 2018 and the ranking of port also dropped 6 steps. According to that research, deteriorated productivity of Busan came from the failure to appropriately respond to average handling volume increase of the ship efficiently3).
Whereas to upgrade port productivity, operation integration among terminal operators, just previous step for going corporate integration finally may give solution, which ensures maximization of resources utilization.

Busan Port’s Port Productivity Comparison (unt : box, hour, %)
Hongkong, by the way, is a good example of successful operational integration among HITㆍMTLㆍACT in 2018 in front of continuous volume leakage to neighbouring Chinese ports, Shenzhen and Guangzhou. The case of Hongkong signals a strong implication to Busan, which encounters unnecessary inefficiencies caused by excessive multiple terminal operator system. In case of old port in Busan, there are 3 operators, though reduced after several integrations initiated by the government in the past, operating 17 berths. In case of the New port, 5 operators are operating 21 berths and two more operators will be added when Phase 2-4 and Phase 2-5 is opened in 2022 and 2023. Closely looking at the situation in New port, having T/S cargo around 70% of total volume, individual terminal operator fails to accommodate all the alliance vessels because of insufficient facilities, when T/S.
2.2.3 Cost Competitiveness Viewpoints
Shipping company’s profit and loss in business are decided by the difference between the freight collective from the shippers and cost payable to several contracted service vendors. Therefore, to have profit, carriers have to increase freight level and lower cost level as much as they can do. However, The freight level is decided by the market behaviour based on the supply of loadable capacity of the vessel and loadable volume of cargo in general, hence, carrier has little room to lead the market because of the heavy exposure to competition with other carriers. In case of the cost, on the other hand, they mostly have initiative in dealing with contracts and try to cut the price at all the times. As explained, Terminal Handling Charge (THC) for loading/unloading the cargo is the biggest cost item of carriers in the port, carriers are very keen to choosing the T/S port which may offer reasonable levels of charges also providing a good service to them. When assessing the cost competitiveness of a certain port, the cost level itself, to a great extent, matters, however more importantly, comparative cost level, while comparing to the competing port, is more important. A good example of this is seen at the comparison between Busan and Chinese ports. Even if THC level for T/S cargo in Busan is comparatively low, however, is still much higher than competing Chinese ports. This gap comes from Chinese ports' unreasonably low rate and it seriously weakens T/S competitiveness of Busan port in attracting Chinese origin cargo. Along with THC, Inter-Terminal Transportation (ITT) cost in Busan, increasingly becomes an issue on the point of threat factor for competitiveness. ITT occurs when a container has to be transported for T/S inter-terminals and extra trucking cost incurs while moving the containers. Several situations brings about ITT, among them, split terminal operation tops the reasons. With the 3 Alliance system4), terminals are required to accommodate all the contracted carriers at a single place if the ports have a high T/S volume as Busan. In case of Busan, ITT occurs because of two reasons: two ports operation system and operation by multiple operators having insufficient berths. Even though Busan is off-setting such cost handicaps with strong geographic merits and operational advantages compared to competing Chinese ports, the increasing cost burdens to carriers when T/S at Busan may weaken carrier’s motivation to continue fleet operation pivoting Busan.
2.3 Implication and Theoretical summary
T/S cargo in Busan has special importance in ensuring sustainability as representing NE Asia gate port for long while as yet. When considering its economic effect created by the cargo handling in the port, it has much higher contribution to industries than export/import cargo from the macro point of view. With the advancement of national industrial structure in Korea, the container volume growth of Busan can not exceed GDP growth, which stays around 2% slightly more or less. This is explained by the transition of economy from the manufacturing sector to non-manufacturing sector and factory relocation to countries having labor cost advantages.
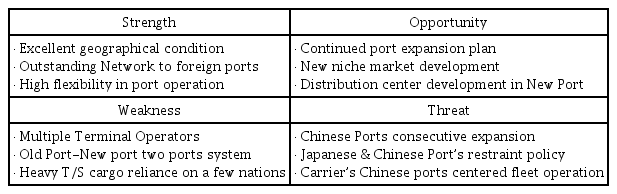
T/S SWOT Analysis of Busan port
In order to secure the sustainability under current circumstances, Busan port has to find a breakthrough from the T/S cargo growth by taking advantage of geographical merit encompassing global economy giants. With the fast development of Chinese ports, however, Busan is encountering strong challenges from Chinese ports who are about to turn the direction of growing strategy to T/S cargo sector. Because of proximity, Chinese ports’ development sheds the green and red lights at the same time. Chinese ports volume growth can give Busan more T/S opportunities, however, this may on the other hand, accelerate the chain of fleet operation to Chinese port centered configuration in NE Asia and encroach the cumulated T/S volume in Busan.
As aforementioned, there are several requirements to be a T/S specialized port, for instances, as Singapore, Busan, Hongkong, Dubai and PTP. All these global ports, broadly speaking, share common features: ① geographical merit, ② excellent network with overseas ports, ③ outstanding productivity and services, ④ high cost competitiveness. Therefore, Port Authorities who plan to promote their ports as regional or global hub ports, have to concentrate capabilities on above four points. Except the geographical point which is uncontrollable, factors can be improved by the consistent efforts on them.
2.4 Policy suggestions for T/S competitiveness enhancement
Based on the four critical factors which decide T/S competitiveness of Busan, substantial action plans are suggested here. Such action plans are then analyzed from the eyes of industry in order to verify if they are workable and effective for enhancing T/S competitiveness of Busan. After verifying the validity as elements to enhance T/S competitiveness of Busan, level of importance among suggestions are rated in order. A higher score of importance and urgency means that the suggestion must be enacted within a short period.
First, on the geographical prospect, global carriers‘ participation at the terminal operation is suggested. When carriers appoints T/S ports, they are giving high priority on the location of the port. Typically, the last port on the service route, which is nearest to destination is preferred as T/S port to save the transit time. Busan is the nearest Asian port from America and encompassed by China and Japan which are, tightly connected by the highly developed feeder network from Busan. When Global ocean carriers secure T/S bases in Busan, it will accelerate the concentration of cargo in Busan, which will ensure steady volume growth.
Secondly, highly developed feeder networks to overseas ports are offering favorable flexibility to mother carriers in operating T/S network. Without deploying own vessels, mother carriers can receive support from feeder carriers while paying reasonable feederage. In Busan, feeder carriers have strong foothold in Old port, however, they do not have own dedicated terminals in New port and this is connected to the unnecessary ITT cost between the Old port and New port. If feeder carriers have stronghold in New port, connection with China and Japan will be much eased, moreover cheaply, and this will contribute to the T/S volume growth from/to those nations having large T/S cargo proportion now.
Thirdly, Busan has moderate port productivity and service level, however, excessively multiple operators, particularly in New port, have fundamental limitation to accommodate alliance fleets all at once, therefore, carriers have to move T/S containers from one terminal to the other terminal by paying trucking charges and this is weakening the cost competitiveness in Busan. To overcome this problem and to improve productivity to attract more services, especially during the weekends services5), currently multiple operators should be integrated to make it as few as possible having numbers of berth enlarged up to 6 more.
In addition, logistic functions in Busan should be also merged into New port, therefore, port expansion in New port has to be progressed timely without stoppage even though many disputes over this issues exist. With the timely phased New port expansion Old port shutdown should go abreast while elaborately predicting future volume flows. Let alone those hardware expansions, institutional support, such as open policies considering carrier’s convenience in handling cargo without excessive restrictions in documents and traffics should be backed up as well.
Fourthly, Cost competitiveness level in Busan, in the area of THC particularly, is comparatively much worse than competing Chinese ports. This situation results from unreasonable rating to T/S cargo in Chinese ports having very limited proportion of T/S cargo around 5% more or less in most ports. Currently, whereas Busan is responding to the situation by providing better services, however, the big gap in the cost will have destructive power if Chinese ports determine hard to compete with Busan for capturing more T/S cargo. Furthermore, in addition to the unfavorable THC level of T/S cargo in Busan, increasing ITT cost raised from the split operation by multiple operators sheds red lights in the Busan’s efforts to maintain the status of gate port in NE Asia. Terminal integration and securing enlarged infrastructure therefrom can be a more fundamental solution, however, Port Authority has to continue incentive schemes and offering ITT subsidy to carriers for the time being until fundamental solution in the operational sector is accomplished.

Summary of suggestions and Benchmarking Ports.
2.5 Preceding Research Analysis
Ahn, K. M., Kim, S. Y. and Kim, I. S.(2008) studied about ‘Negative factors affecting competitiveness of Busan port’. Writers pointed out excessive volume competition resulted from the continued port expansion by New port project, among operators making degradation of quality service in the port as the root cause and mentioned terminal operators have to respond to unfavorable challenges by attracting more cargoes. Writers suggested that the Busan Port has to integrate terminal operators in order to improve productivity and efficiencies and added another suggestion to invite global carriers to terminal operation for securing steady volume growth. Writers also suggested, though not as core suggestions, that stable port operation and T/S cargo increase through the distribution park expansion in New port should be on the active policy agenda in the governmental level.
Kim, G. S. and Kwak, K. S.(2008) studied on ‘Substantial action plans to improve T/S competitiveness of Busan port’. Writers expressed concern about the undergoing cargo outflows into Chinese ports due to large scaled ports development in China and predicted that this trend will not be stopped unless extraordinary counter -measurements from Busan should be followed up immediately. As counter-measurements, writers proposed preferential enhancement of cost competitiveness in order to respond to Chinese ports’ fast progression. As another plan, writers emphasized the necessity to induce domestic terminal operators to be grown up to GTO level in order to hold competitiveness.
Ryoo, D. K., Choi, J. Y. and Kim, T. G.(2012) studied about ‘Plan to stabilize the Market of Terminal business in Busan’. Writers defined current Terminal business as an over-capacity market and diagnosed deteriorated financial status of terminal operators should be attributed to excessive competition among terminal operators for capturing cargoes. Writers conclusively pointed out immoderate competition was originated from the market structure having multiple operators and suggested that the plan to integrate terminal operators for building stable market structure.
Lee, C. B. and Kwon, A. R.(2014) studied on ‘Competitiveness comparison among NE Asian ports’ through hhift-share methodology. Writers proposed that Busan has to maximize the locational merits and consecutive port expansion and proactive target marketing aiming global carriers should be backed up. Whereas, on the point of fundamental approach to improve competitiveness of Busan port and enhance efficiency, writers put emphasis on the transformation to single operation system from Old port-New port systems, port infrastructure expansion and ICT development, and scaling-up of incentive system should be followed up.
Song, G. E.(2014) carried out research on ‘Factor analysis on deciding Competitiveness of Global Container Terminals’. Writer raised 3 factors as analysis tools to evaluate competitiveness of the port comprising ‘Subjective factor’, ‘Managerial environment factor’ and ‘Government’s Institutional factor’ and compared priority in importance. In writer’s conclusion, among 3 factors, subjective factor which is primarily focusing on the mission-oriented behaviour of the company rather than concentrating on external values and behaviours as the most important factor. Then writer evaluated the order of importance as ‘Managerial factor’ and ‘Government’s Institutional factor’ as the last. Writer explained that the subjective factor includes steady efforts to increase cargo volume, offer reliable services to customers with speed and stability, provides reasonable rate to carrier through the improvement of productivity and to expand business by way of strategic collaboration with market players.
Kang, D. J.(2015) carried out research on ‘The Characteristics of Network affecting outputs of Global ports’. Writer, in his research, emphasized that port expansion should be more focused on carrier’s standpoint which is related to the level of network than volume increases simply. Writer, when he mentioned network, interpreted concept of network as centrality how it connects origin and destination in major routes of focused markets in certain port. In writer’s evaluation of centrality, the ranking of the ports was Hongkong, Singapore, Busan,then, Shanghai in respective order.
Park, H. C., Lee, S. Y. and Ahn, K. M.(2018) carried out the research on ‘Reconfiguration of Terminal Operator in Busan To enhance T/S Competitiveness’. Writers pointed out 5 factors which deteriorate T/S competitiveness of Busan: Global Ocean Carrier’s non-participation in terminal operation, National carrier’s non-operation of fully dedicated terminal, High proportion of Financial Investor’s shares in terminal operation company, Multiple terminal operator system, Port Authority’s limited role staying simply as land-lord. Writers, among them, pointed out multiple operator system as the most significant factor that requires prompt attention and settlement. As the immediate solution for this matter, writers proposed operational integration among operators first, into 3 groups who are in the same linear layout, then corporate integration should be made in the end.
3. Modelling of Analysis
3.1 Research Model
For analysis through AHP (Analytic Hierarchy Process) Model, 7 action plans whose validity once have been duly verified through the theoretical backgrounds study and preceding researches in Chapter 2 are derived and analyzed if they are workable and effective by the survey where all the influential samples in evaluating the effectiveness and sequence of importance are answered. Core objective of this process is to verify conformity between the writer of this paper and industry, then, to find the order of action plans having importance in order to enhance T/S competitiveness of Busan in the end.
A. Terminal Operator integration
B. Port Infrastructure Expansion
C. Global carriers Owned terminal operation
D. Enhancement of National carrier’s competitiveness
E. Feeder carriers’ owned terminal operation in New port
F. Institutional Support for effective and convenient environments for handling T/S cargo
G. Volume Incentive expansion (including ITT Cost subsidy).
3.2. Data collection and Analysis Method
For collecting the data and enhancing the accuracy of the analysis, survey and interview have been carried out together. Also in order to raise reliability of the survey, questionnaire items have been modified after preliminary investigation about the questionnaire. The samples, in the mean time, include all the parties who are fully eligible to assess the survey: Carriers (Global carriers, National Carriers, IntraAsia Carriers), Terminal Operator (GTO, Local Operator in making business in New port and Old port), Port Authority. The results of questionnaire collection is indicated in Table. 9
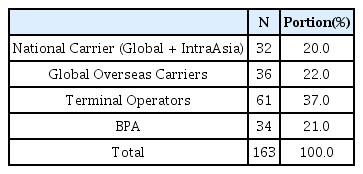
Survey response samples
Methodology for this research is AHP (Analytic Hierarchy Process) which is well known to be efficient when analyzing the factors by determining hierarchy. Fig. 3 is the Modelling of the analysis process.
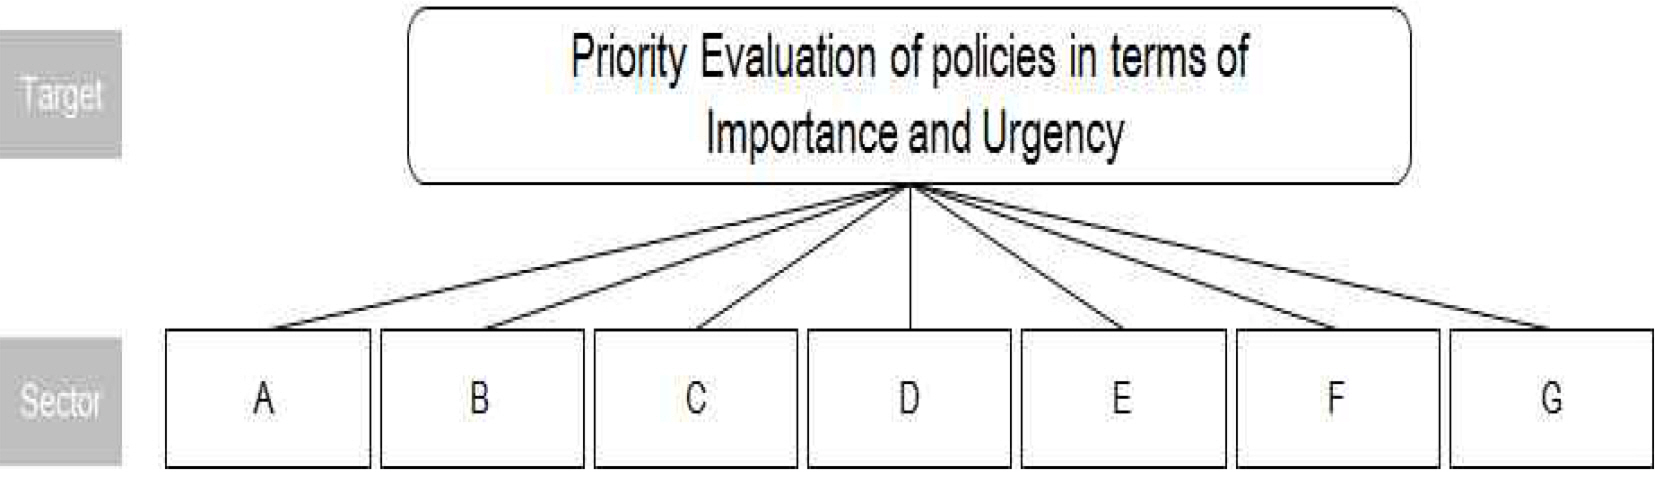
AHP Model
4. Results of Analysis
4.1 Descriptive Statistics Analysis
4.1.1 Descriptive statistics for Evaluating factors Policy Priority
To verify and confirm if 7 suggested policies are workable and effective in enhancing T/S competitiveness of Busan, survey has been done and the outcomes of it is marked below in Table. 10

Descriptive statistics for Effectiveness of Policies
4.2 Results of descriptive Statistics Analysis
4.2.1. Results of Pairwise comparison among policies
For the analysis and evaluation on how proposed policies are recognized in the level of importance, elements of policies are matrixed and weights of each policy are indicated in Table 11.

Pairwise comparison among factors
Each factors’ degree of importance average is calculated by the geometric average through AHP and to evaluate the credibility of response when CR (Credibility Ratio) value is higher than 0.1, response has been excluded to ensure credible value of response for precise analysis.
4.2.2. Weight Analysis for the comparative importance evaluation
Whereas, in comparative importance evaluation among elements of policies, results of evaluation is indicated in Table. 12. According to the results of analysis, Terminal Operator Integration (A) showed the highest score (0.1602), and the rest of the elements of policies showed scores as follows: Port Infrastructure Expansion (B/0.1597), Enhancement of National carrier’s competitiveness (D/0.1577), Institutional Support for effective and convenient environments for handling T/S cargo (F/0.1408), Volume Incentive expansion including ITT Cost subsidy (G/0.1312), Global carriers Owned terminal operation (C/0.1281), Feeder carriers’ owned terminal operation in New port (E/0.1224). The CR value of this analysis showed 0.0006 which is lower than 0.1, therefore, the results of analysis seem to have comparatively high credibility.
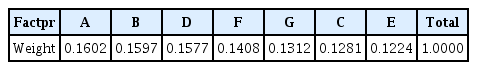
Weights of Importance among Elements of Policies
5. Conclusion
This research intends ultimately to suggest action plans to Port Authority and Government on how to enhance T/S competitiveness of Busan, which is currently encountering strong challenges from several directions, however, mostly attributable to internal circumstances. Before proposing suggestions, the backgrounds on why Busan has to find the way of sustainability from T/S cargo sector are questioned and answers are given with two factors which can be explained by its economic benefit in macro prospect and continued shrinkages of growth potential in import/export cargo due to the shifting of manufacturing factories to out of nation for seeking cheaper costs and change of industrial structure, therefore, without T/S cargo Busan is unable to achieve higher growth than 1% ∼2% annually, which is a similar rate of national GDP growth. Busan has long maintained the status of unrivalled NorthEast Asia gate port, however, arrives at the crossroads for going forward or backward.
To draw action plans, this paper starts to verify which factors affect T/S competitiveness of the port. Through the theoretical studies and advanced researches, four factors, Location of the port, Network with overseas ports, Port Productivity & Services, Cost competitiveness, are known to decide the level of Competitiveness. While keeping these four factors under the study baseline, action plan pertinent to each decision factor is suggested. Those action plans are analyzed, whether workable and effective, by the samples collected from shipping companies, terminal operators and Port Authority through AHP methodology. All the seven action plans, through the analysis, proved to have positive influence in enhancing T/S competitiveness of Busan. Whereas, in the evaluation of weight and priority among factors from the standpoint of importance, the most important and urgent task to do was Integration of Terminal operator, consequently, if put the rests in order of importance and urgency, Port Expansion, Enhancement of national carrier’s competitiveness, Institutional Support for effective and convenient environments for handling T/S cargo, Incentive scheme expansion, Global carrier’s terminal operation, Feeder carriers’ owned terminal operation in New port are followed. The results drawn from this research assume to have persuasive implications because the samples of survey engaged in this research are highly insightful for the subject of this research. Furthermore, the plans discussed in this research are assumed to be sufficient to provide insights to foreign port authorities when they plan to promote their ports as T/S specialized ports. One thing, however, more to do in future is to expand survey scope to headquarter of the foreign shipping companies who are directly engaged in the selection of T/S port and Global Terminal Operators in order to achieve more objectives and wide scoped outcomes of research, even though they are believed to have the same view as this research. Nevertheless, by specifying and evaluating effectiveness of every requirements as competitive T/S port with scoped comprehension and offering detail guidelines to Port Authority in charge of Busan port. this study may have discrimination from the preceding researches which largely focused on the effect verification of particular subjects in deciding T/S competitiveness of Busan port.
Notes
1) New port operates 21 berths having 69 Quay Cranes, therefore, unit numbers per berth is around 3.3 which falls shorts of global major terminal having average 4.0
2) Until 1998, Busan adopted public tariff system, later changed to contract rate system reflecting industry’s suggestion.
3) Ministry of Maritime and Fisheries, The 4th National port Development Plan (2021–2030)
4) 2M:Maersk, MSC, The Alliance: Hapag-Lloyd, ONE, HMM, YML, Ocean: CMA-CGM, EMC, COSCO
5) In Busan, carriers put more services during the weekends remarkably, hence, congestion during weekends becomes realistic obstacles enough to lose opportunities to increase T/S cargo, unless otherwise gainable with exemption of weekends surcharges in terminals