Study on the Relationship and Validity of the Management Evaluation Factors in Public Firms With a Focus on the Port Authorities
Article information
Abstract
According to the results of the management evaluation of the nation’s public firms over the past seven years, the rating of the port corporation is generally insufficient. According to the results of the seven-year study 2011-2017, the average debt ratio of the port corporation was 34.5%, two to three times lower than that of the general public company, the operating profit ratio of sales was three times higher, and the value added per person was 1.6-1.9 times better. However, the aggregate score and grade were generally low, with 4.1% of the total number of employees of the general public corporation, 10% of the average total assets, and 1% of the average sales volume. The distributed analysis results and panel return analysis results show that the size significantly impacts the overall score and grade. Additionally, major business standards such as port volume, not controlled by the port corporation, appear to have a decisive influence on the low grade of the port corporation. Thus, it appears that improvement and supplementation of key business indicators of port construction are urgently needed in the management evaluation system, which can be properly controlled.
1. Introduction
The korean management evaluation system of public firms objectively evaluates the performance of public institutions in the previous year and links the results to executive personnel and employee performance. This system was first implemented by the Ministry of Economy and Finance in 1984 as a system to induce publicity, efficiency and responsible management of public institutions. Although the management evaluation system was introduced by the enactment of the Government Investment Management Framework Act in 1984, it was not organized as a performance management tool for public firms due to incomplete evaluation organization and manpower composition, evaluation procedure, evaluation index system, and incentive system(Park, S.H., 2006). Since 1998, many improvements have been made throughout the management system of public firm, including management evaluation systems such as evaluation indexes and utilization systems, but the effects of the system change were somewhat limited due to limitations in data and environmental factors(Park, 2006). Under the Act on the operaten of Public Institutions enacted in 2007, the government classified public institutions established and operated under the government's investment, investment, or government financial support as public firms, quasi-government organizations, and other public agencies, and sought to change the system of management of public firms. In other words, the government intended to induce public firms to innovate their management and improve productivity based on specific performance indicators.(Kim, J.K, 2001). This has led to the gradual development of the management evaluation system as a means to induce efficient performance management of public firms. 그And it was recognized that by promoting learning and competition, it could contribute to organizational performance and improvement.(Oh, 2003; Kwak, 2003). This management evaluation system gradually reduced the management system of state-owned firm through proactive and bureaucratic control in a way to expand autonomous responsibility management. And performance management could be established in a post-apartheid way.(Park, 2006).
As such, the management evaluation system of public firm has continuously improved since 1984, but the diversity of the purpose of establishment and environmental characteristics has not been fully reflected in the management evaluation index. In particular, port firms with relatively few years or sizes are increasingly exposed to problems that are considered disadvantageous. Lee and Ahn(2013). Therefore, the purpose of this study was to provide improvement measures for evaluation problems by diagnosing the relevance and validity of the indicators between the current management evaluation indexes and scores of public firm. The purpose of this research is to present improvement measures with emphasis on PA and public firm.
2. Theoretical Background
According to Article 48 of the Act on the Operaten of Public Institutions, “The purpose of this service is to improve public service and management efficiency and to provide professional consulting on matters that need improvement”(the Ministry of Economy and Finance, 2011) Management evaluations are being conducted on public firm. The purpose, necessity, and evaluation criteria of management evaluation of state-owned firm were first studied by the Korea Development Institute in 1987. According to this report, the purpose of the management evaluation is to induce total improvement in the management of public firm by setting an indicator of the goals and directions to be achieved by public firm in advance, and by assessing their performance at a later date and taking responsibility for compensation and liability. However, unlike private firms, public firm managers have serious problems with inefficient management such as lax management and rigidity in decision-making. Therefore, it suggests that management evaluation is necessary to control and improve this. The theory of neo-institutionalism explains the inefficiency of management of state-owned firm as a matter of property rights, agency theory, X-Inefficiency and market failure theory.
The final owner of a public corporation is the people, but because the people cannot manage it themselves, it is called an ownerless firm. The ownership characteristics of such a public entity create a agency problem, which results in lower performance of the public entity. X-efficiency(Leibenstein) refers to the inefficiency that results from lax management and lax management of the organization's members in the effort to pursue management efficiency or in the reduction of incentives, a concept similar to moral hazard in agency theory. Problems of X-efficiency arise due to excessive costs due to the complacent working posture and risk-averse behavior of executives and employees of public firm. This can be said to be preventing public firms from functioning efficiently.(Oh and Jang, 2003).
According to the market failure theory of C. Wolf, the conditions for demand and supply for public sector activities indicate the failure of the public sector in the form of additional costs, internal effects and derivative externalities. In other words, the vast internal organization and personnel of public firm, the establishment of excessive subsidiaries, and the lax management of excess production and over-investment are shown.(Shin, 2011). Therefore, the management evaluation system has developed as a post-performance management system to solve the above problems and provide appropriate information for management decision making, to promote management innovation and secure the responsibilities of the organization. Also, public firms are run by appointed managers who take responsibility for the appointees, so there is a high possibility of political intervention in the management process and political motivation taking precedence. Therefore, it was emphasized that it is desirable to control the performance of the management in a follow-up manner, not to interfere in the management process in detail, for efficient management(Park, 2006).
As a prior study, prescriptive and empirical studies have been conducted on the necessity, usefulness and improvement measures of the management evaluation system. In relation to this research, the recent empirical research conducted on the usefulness and improvement measures of the management evaluation system of public firm is as follows.
Choi and Park(2009)'s research analyzed the evaluation results between 2001 and 2005. According to the analysis, no significant improvement was found in terms of comprehensive management, major business and management. This suggests that the current management evaluation system of public firm does not properly grasp the efficiency of public firms and that the evaluation system and evaluation index have limitations.
An(2014)'s study analyzed the relevance between the comprehensive evaluation scores of public firms and quasi-government organizations between 2008 and 2012 and the scores of non-metering and metric indices by evaluation category (leadership, responsibility management, management efficiency, and major projects). According to the analysis results, management efficiency category scores by evaluation category and non-metric index scores have a significant impact on the final overall evaluation score. In addition, the larger the size of the institution, the higher the profitability, growth rate, and the longer the agency's chief executive's tenure, the higher the overall score of management evaluation. In the leadership, accountability, and major projects, the size and profitability of the institution were significantly shown, and in the management efficiency category, the financial characteristics (profitability, activity, growth) were significantly shown. It has demonstrated that non-criticality scores are high in cases where institutions are large and belong to market-type public firms. However, the higher the profitability, activity and growth, the higher the index score and the lower the index score for semi-market-type public firm.
3. Size·Financial rate of PA
3.1 Comparison of Size between PA and Public firm
Busan Port Authority(BPA)'s total employees for 2017 stood at 223, an annual increase of 7% compared to 149 in 2011 The total number of employee in 2017 at Incheon Port Authority(IPA), Yeosu Gwangyang Port Authority(YGPA) and Ulsan Port Authority(UPA) increased by 9.4%, 8.3% and 14.4%, respectively, compared to 199, 109 and 78 in 2011, respectively. The average total number of employees at the four PA increased 9% annually to 174 in 2017, compared with 104 in 2011. During the seven years, the average employees of the four PA was 142, which is only 4.1% for market-type(Public firmⅠ:Pub.Ⅰ) and semimarket- type(Public firmⅡ:Pub.Ⅱ) public firms. Table 1

Contrast of Average staff between PA and Public firm (unit: person, %)
BPA's total assets in 2017 totaled 5.62 trillion won, up 2% annually from 5.27 trillion won in 2011. The total assets of the IPA, YGPA and UPA stood at 2.943 trillion won, 1.825.4 trillion won and 797.4 billion won, respectively, in 2017, down 2.8 %, - 4.9 % and 6.1 %, respectively, from 2.4658 trillion won, 2.469 trillion won and 558.4 billion won in 2011, respectively. The average total assets of the four PA increased 1% annually to 2.793 trillion won in 2017, compared with 2.724 trillion won in 2011. During the seven-year period, the average assets of the four port firms stood at 2.724 trillion won, accounting for only 11.7 % of market-type public firms and 14.4 % of quasi-market-type public firms. The BPA posted 341.4 billion won in sales in 2017, up 5.3% annually from 251 billion won in 2011. Sales of IPA, YGPA, and UPA decreased by 10.2%, 29.8%, and 5.8% annually, respectively, from 82.3 billion won, 23.4 billion won and 59.1 billion won in 2011. Table 2

Contrast of asset between PA and Public firm (unit: billion won)
The average sales of the four PA reached 171 billion won in 2017, up 8.6% annually from 147.8 billion won in 2011. The average sales of the four PA over the seven-year period amounted to 1,47.8 billion won, only 1.7 % of the market-type public firms and 4.6 % of the quasi-market public firms. Table 3

Contrast of sales between PA and Public firm (unit: billion won)
3.2 Comparison of Financial rate between PA and Public firm
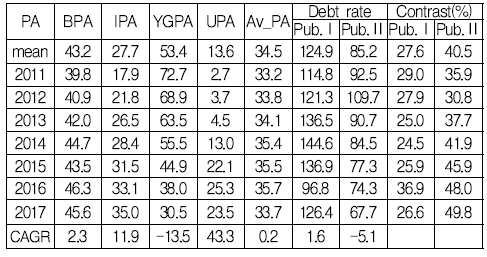
BPA's debt rate stood at 45.6 % in 2017, up 5.3 % annually from 39.8% in 2011. The debt rate of IPA, YGPA and UPA stood at 35 %, 30.5% and 23.5% in 2017, respectively, with the annual average increase of 11.9%, -13.5% and 43.3%, respectively, compared to 17.9%, 72.7% and 2.7% in 2011. The average debt-to-equity ratio of the four PA increased 0.2 % annually to 33.7 % in 2017, compared with 133.2 % in 2011. The average debt rate of the four PA over the seven years is 34.5%, which is only 27.6 % for market-type public firms and 40.5% for semi-market-type public firms. Table 4

Contrast of debt rate between PA and Public firm (unit: %)
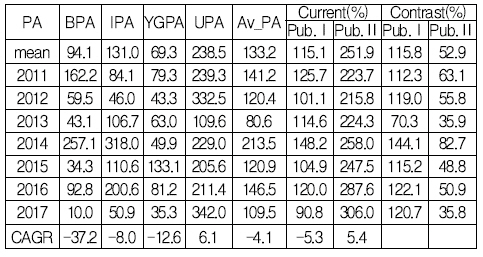
The BPA's current rate stood at 10 % in 2017, down 37.2% annually from 162.2% in 2011.
Current rate of IPA, YGPA and UPA in 2017 was 50.9 %, 35.3% and 342%, respectively, with the annual average rate of –8%, -12.6% and 6.1%, respectively, compared to 84.1%, 79.3% and 239.3% in 2011. The average current rate of the four PA stood at 109.5% in 2017, down 4.1% annually from 141.2% in 2011. The average current rate of the four PA over the seven-year period stood at 133.2%, or 115.1% of market-type public firm and 251.9% of semi-market-type public firm. Table 5

Contrast of current rate between PA & Public firm (unit: %)
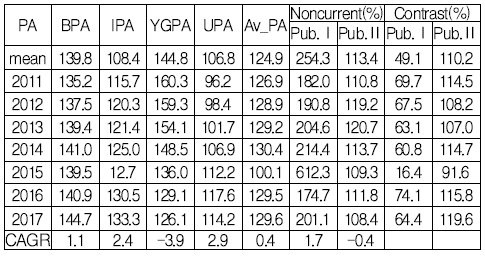
The BPA's Non-current rate stood at 144.7% in 2017, down 1.1% annually from 135.2% in 2011. Non-current rate of IPA, YGPA and UPA in 2017 was 133.3%, 126.1%, and 114.2%, respectively, with the annual average rate of 2.4%%, -3.9% and 2.9%, respectively, compared to 115.7%, 160.3% and 96.2% in 2011. The average Non-current rate of the four PA stood at 129.6% in 2017, down 0.4% annually from 126.9% in 2011. The average Non-current rate of the four PA over the seven-year period stood at 124.9%, half that of market-type public firm and double that of semi-market-type public firm. Table 6

Contrast of Noncurrent between PA and Public Co. (unit: %)
The BPA's NI/sale(rate of net income for sales) stood at 41.7% in 2017, down 7.1% annually from 64.8% in 2011.
NI/sale of IPA, YGPA and UPA in 2017 was 23.7%, 18.7%, and 37.6%, respectively, with the annual average rate of 6.9%, 81.9% and –5.1%, respectively, compared to 15.8%, -57.4% and 51.6% in 2011. The average NI/sale of the four PA stood at 30.4% in 2017, up 8.5% annually from 18.7% in 2011. The average NI/sale of the four PA over the seven-year period stood at 28.1%, or 290% of market-type public firm and 310% of semi-market-type public firm.
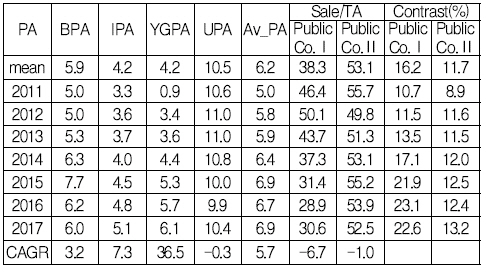
The BPA's turnover of total asset(Sale/TA) stood at 6.0% in 2017, up 3.2% annually from 5.0% in 2011. Table 7

Contrast of NI/sale between PA and Public Co. (unit: %)
Turnover of total asset of IPA, YGPA and UPA in 2017 was 5.1%, 6.1%, and 10.4%, respectively, with the annual average rate of 7.3%, 36.5%, and –0.3% respectively, compared to 3.3%, 0.9% and 10.6% in 2011. The average turnover of total asset of the four PA stood at 6.9% in 2017, up 5.7% annually from 5.0% in 2011. The average turnover of total asset of the four PA over the seven-year period stood at 6.2%, or 16.2% of market-type public firm and 11.7% of semi-market-type public firm. Table 8

Contrast of Sale/TA between PA and Public Co. (unit: %)
The BPA's growth rate of sale(Gro_sale) stood at – 2.5% in 2017, down 2.5% annually from 1.4% in 2011.
Growth rate of sale of IPA, YGPA and UPA in 2017 was 8.2%, 2.2%, and 6.5%, respectively, with the annual average rate of 9.2%, 61%, and –0.6% respectively, compared to 13.3%, 245.4% and 6.3% in 2011. The average growth rate of sale of the four PA stood at 3.6% in 2017, down 44.2% annually from 7.5% in 2011. The average growth rate of sale of the four PA over the seven-year period stood at 17.3%, or 530% of market-type public firm and 330% of semi-market-type public firm.
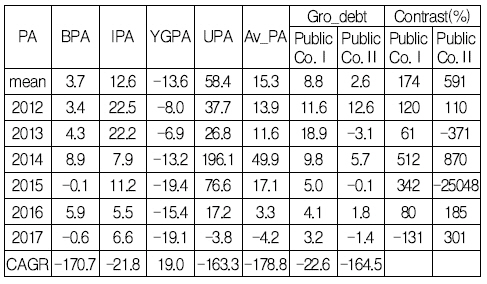
The BPA's growth rate of debt(Gro_debt) stood at 3.7% in 2017, down 170% annually from 3.4% in 2012. Growth rate of debt of IPA, YGPA and UPA in 2017 was 6.6%, -19.1%, and –3.8%, respectively, with the annual average rate of –21.8%, 19%, and –163.3% respectively, compared to 22.5%, -8.0% and 37.7% in 2012. The average growth rate of debt of the four PA over the seven-year period stood at 15.3%, or 174% of market-type public firm and 591% of semi-market-type public firm. Table 9

Contrast of Gro_sale between PA and Public Co. (unit: %)
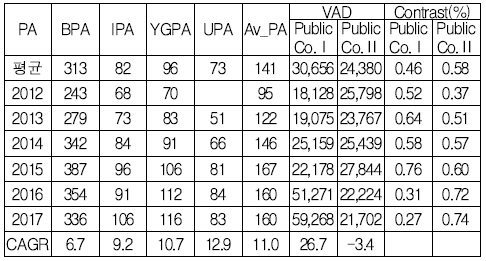
The average value added for the seven-year period between BPA and IPA is 313 billion won and 82 billion won, while YGPA and UPA are 96 billion won and 73 billion won, respectively. The average of the four PA is 141 billion won, 0.46% that of market-type firm and 0.58% that of semi-market-type public firm. Table 10

Contrast of Gro_Debt between PA and Public firm (unit: %)
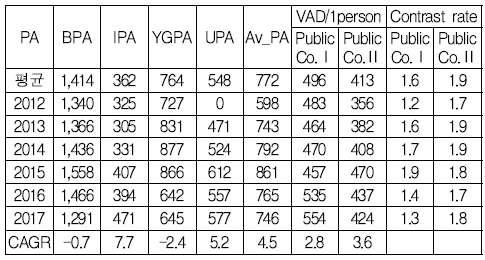
The average value added per person for the seven-year period between BPA and IPA is 1,414 million won and 3.62 million won, while YGPA and UPA are 764 million won and 5.48 million won, respectively. The average of the four port firms is 7.72 million won, 1.6 times that of market-type firm and 1.9 times that of semi-market-type public firm. Table 11

Contrast of VAD between PA and Public firm (unit:billion won)
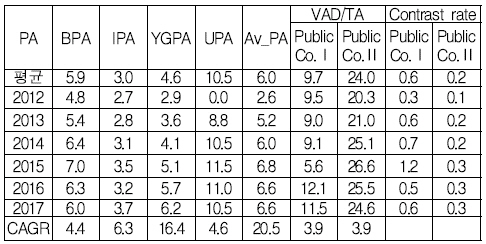
Over the seven-year period, the average total capital investment efficiency of BPA and IPA is 5.9 % and 3.0 %, while YGPA and UPA are 4.6 % and 10.5 %, respectively. The figure is 61.9 % for market-type public firms and 24.9 % for semi-market public firms, which is not enough. The reason is that the value added amount is much smaller than the total capital.
4. Research Methodology and Analysis
4.1 Research Model and Variables
In this paper, First, the significant relationship between the seven management evaluation items and the evaluation results(scores and scores) was measured. Second, the significant relationship between key financial rates(size) and the evaluation results(scores and scores) was measured. In addition, the evaluation items and key financial rates were tested to determine whether they were appropriate as the basis for management evaluation. Therefore, the following research models were constructed to achieve this purpose. Table 12, Fig. 1

Contrast of VAD/person between PA and Public firm (unit:million won)

Research model
4.1.1 Dependent variables(performance)
The performance measurements of public firm as defined in this study were measured by four variables: the overall score, the metric score, the non-measuring score and the score derived from the management evaluation.The measurement method uses the inspection (released data in Alio) scored by the public firm for seven years from 2011 to 2017. Table 13

Contrast of VAD/TA between PA and Public firm. (unit:%)
4.1.2 Independent variables
There are two main independent variables defined in this study. The first type is seven management evaluation items: strategy, social contribution, work efficiency, organization management, financial management, welfare management, major businesss. The second type is financial stability (Debt rate), liquidity(current rate), asset-capital adequacy (non-current rate), profitability(return on capital), productivity(total capital investment efficiency), efficiency (turnover on total asset), and sales size as the main factors. These variables are also measured using calculated figures by obtaining data on the financial statements of public firm (data disclosed in Alios) for seven years from 2011 to 2017. Table 14

Score and Evaluation items
4.2 Research Hypothesis and analysis method
Hypothesis I was established as follows by testing the relevance of seven evaluation items to their management performance.
[HⅠ] Evaluation items will affect public-firm’s performance.
[HⅠ-1] Strategy will affect public-firm’s performance.
[HⅠ-2] Social contribution will affect performance.
[HⅠ-3] Work efficiency will affect performance.
[HⅠ-4] Organizational management will affect performance.
[HⅠ-5] Financial management will affect performance.
HⅠ-6] Welfare management will affect performance.
[HⅠ-7] Major business will affect performance.
Hypothesis II was established as follows by testing the relevance of financial rates and size to management performance to assessing adequacy.
[HⅡ] Size·financial rate will affect public-firm’s performance.
[HⅡ-1] Debt rate will affect performance.
[HⅡ-2] Current rate will affect performance.
[HⅡ-3] Non-current rate will affect performance.
[HⅡ-4] Return on capital will affect performance.
[HⅡ-5] Turnover of total asset will affect performance.
[HⅡ-6] Investment efficiency of total capital will affect performance.
[HⅡ-7] Size(sales) will affect performance.
The test model is divided into Model I, which tests the relationship between the management evaluation criteria and the management performance, and Model II, which tests the relationship between the major financial rates and the magnitude variables and the performance. In addition, the analysis method used to analyse Model I and Model II is as follows. First, the T-test and the ANOVA method were used to test the difference between relevant variables according to their size or score. Second, the evaluation of the impact relationship on the performance of public firm was analyzed using the Panel Multivariate Regression.
[ModelⅠ] Relationship Test Model between Evaluation items and public firm’s performance
MPij : Performance of Public Co.[ i = 2011년–2017년, j= 30 public firms total score(y1), Qualitative Score(y2), Quantitative Score(y3), Grade(A=5, B=4, C=3, D=1, E=0)]
Stij : strategy score, SCij : social contribution score, WEFij : work efficiency score, ORij : organizational management score, FINij : financial management score,
-
WELij : welfare management score, BUSij : major business score, β0 : constant, ei : random error
[ModelⅡ] Relationship Test Model between financial rate·size and public firm’s performance
MPij = β0 + β1X1ij + β2X2ij + β3X3ij + β4X4ij + β5X5ij + β6X6ij + β7X7ij + ei
MPij : Performance of Public Co.[ i = 2011–2017, j= 30
Public Total score(y1), Qualitative Score(y2), Quantitative Score(y3), Grade(A=5, B=4, C=3, D=1, E=0)]
X1ij : debt rate, X2ij : current rate, X3ij : non-current rate, X4ij : return on capital, X5ij : turnover rate of total asset, X6ij : investment efficiency of total asset, X7ij : size(sales), β0 : constant, ei : random error
4.3 Statistics·T-test·ANONA results
4.3.1 Score and Evaluation items
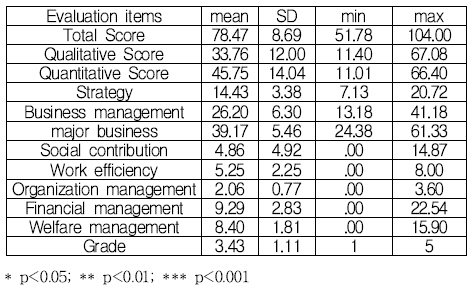
The average total score of 30 public firm over the seven years from 2011 to 2017 is 78.476 (the min score is 51.76 and the max score is 104). Of these, the Qualitative score is 33.76 (the min score is 11.40 and the max score is 67.04), and the Quantitative score is 45.7511 (the min score is 11.01 and the max score is 66.40). Table 15

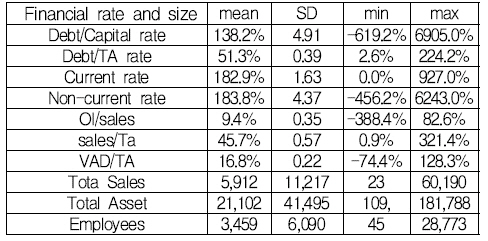
Financial rate and size (unit: billion won, %)
4.3.2 Financial rate and size
The average debt rate is 138.2% and the average debt rate to total capital is 51.3%. Its average total assets are 21.02 trillion won and its average number of employees is 3,459.
4.3.3 T-Test results between PA and other public co.
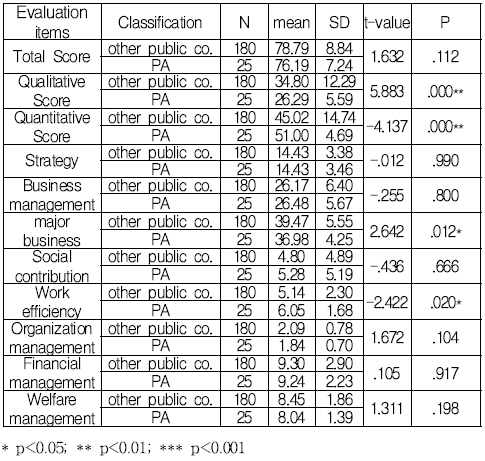
Table 16 shows the results of a T-test between the scores and evaluation indexes between the Port Authority and the General Public firm. Items that show significant differences are Qualitative score, Quantitative score, major business and work efficiency, and others do not show significant differences.

T-test results between PA and other public firm
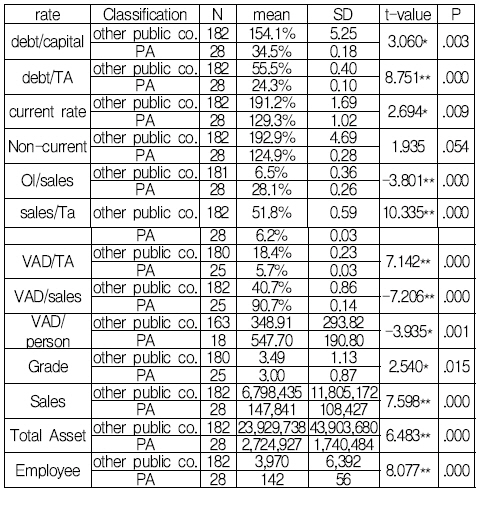
Table 17 shows the results of a T-test between the financial rate and sales size between the Port Authority and the general public firm. Items that show significant differences are debt/capital, debt/ta, current rate, oi/sales, sales/ta, vad/ta, vad/sales, vad/person, Grade, sales, total asset and, employee number.

T-test results between PA and other public firm (unit:billion won, %)
4.3.4 ANOVA results Evaluation items & rate by size
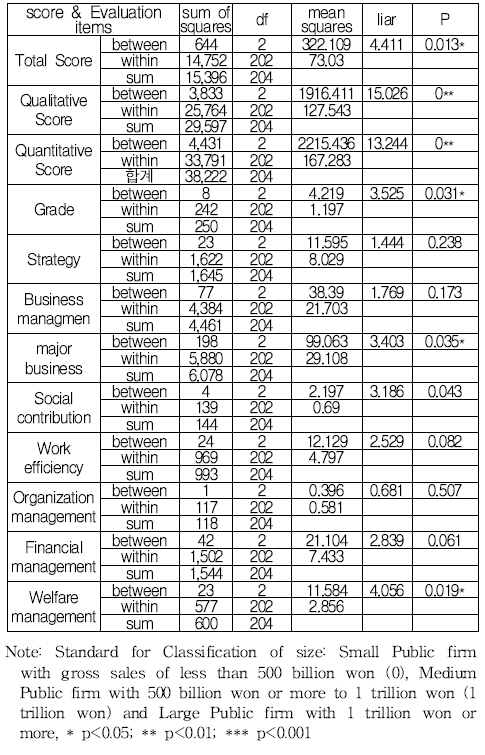
Table 18 shows the variance of analysis results for score and Evaluation items by sales difference. Items that show significant differences are total Score, Qualitative Score, Quantitative Score, grade, major business and Welfare management. But other Items don’t show significant differences. Table 19 shows the variance of analysis results for financial rate by sales difference.

ANOVA results-1 for Evaluation items by size

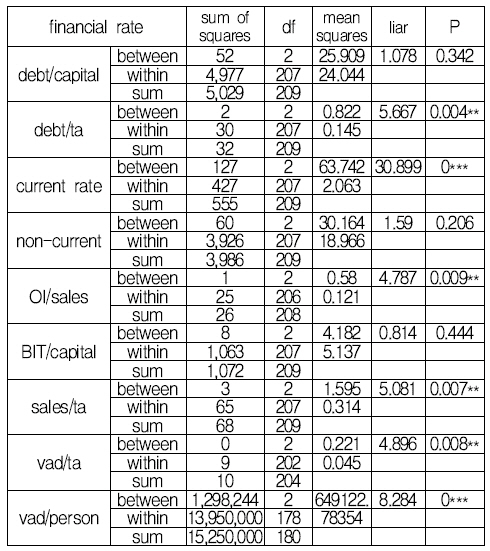
ANOVA results for financial rate
1Items that show significant differences are debt/ta, current rate, OI/sales, sales/ta, vad/ta and vad/person. But other Items don’t show significant differences.
4.4 Panel Regression Analysis results
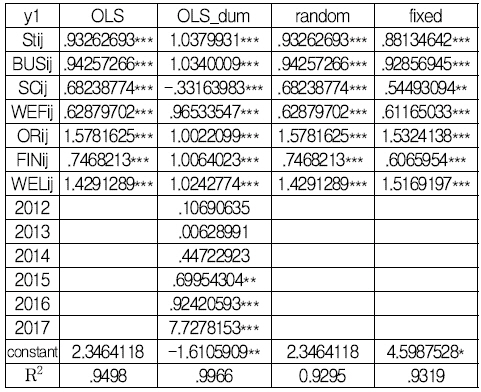
The panel analysis results between the management evaluation items and the overall score(y1) by the OLS, OLS dum, random effect and fixed effect models are shown in Table 20. The four panel regression models have very high R2(determination coefficient) of 0.9498, 0.9966, 0.9295 and 0.9319, respectively, indicating that the models are very suitable. Among them, the R2 of OLS dum is the best analysis model with 0.9966. In addition, all seven management evaluation criteria in all models show very significant relevance(p<0.000) to the overall score, which is the final score of the public firm. Therefore, all seven management evaluation criteria are deemed appropriate for assessing the performance of public firm.

Panel regression results for total score by Evaluation items
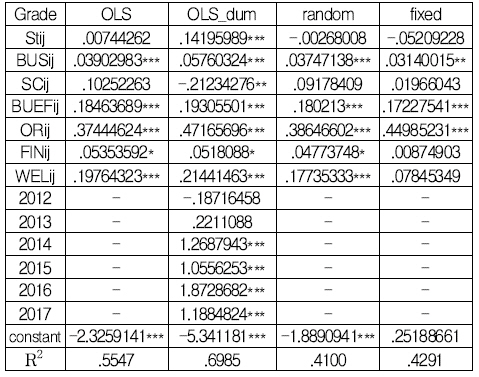
The panel analysis results between the management evaluation items and grade by the OLS, OLS dum, random effect and fixed effect models are shown in Table 21. The four panel regression models have very high R2 of 0.5547, 0.6985, 0.4100 and 0.4291, respectively, indicating that the models are suitable.

Panel regression results for grade by Evaluation
Among them, the R2 of OLS dum is the best analysis model with 0.6985. In addition, all seven management evaluation criteria in all models show very significant relevance(p<0.05) to the grade of the public firm. Therefore, all seven management evaluation criteria are deemed appropriate for assessing the performance of public firm.
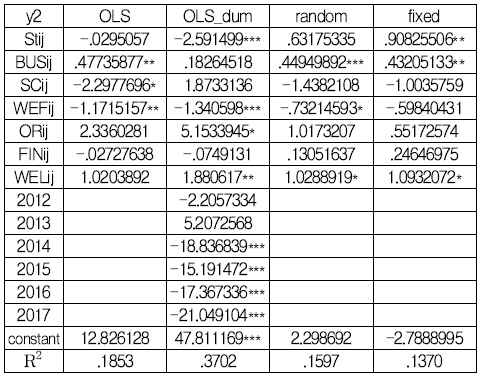
The panel analysis results between the management evaluation items and Qualitative Score(y2) by the OLS, OLS dum, random effect and fixed effect models are shown in Table 22. The four panel regression models have R2 of 0.1853, 0.3702, 0.1597 and 0.1370, respectively, indicating that the models are suitable. Among them, the R2 of OLS dum is the best analysis model with 0.3702. In addition, strategy(Stij) and Work efficiency(WSij) have very significant relevance (p<0.000), welfare management(WELij) has significant relevance(p<0.001) and organizational management(ORij) show significant relevance(p<0.05) to the Qualitative Score of the public firm. But major business(BUSij), social contribution(SCij) and financial management(FINij) don’t show significant relevance.

Panel regression results for y2 by Evaluation
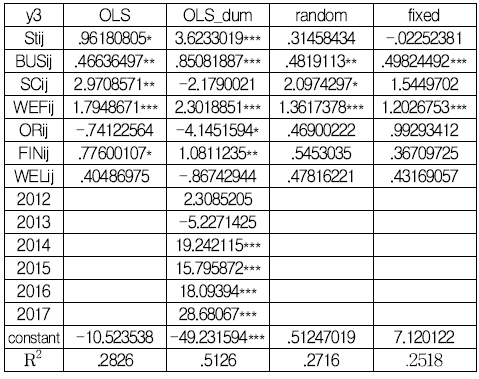
The panel analysis results between the management evaluation items and Quantitative Score(y3) by the OLS, OLS dum, random effect and fixed effect models are shown in Table 23.

Panel regression results for y3 by Evaluation
The four panel regression models have R2 of 0.2826, 0.5126, 0.2716 and 0.2518, respectively, indicating that the models are suitable. Among them, the R2 of OLS dum is the best analysis model with 0.5126. And, strategy(Stij), major business(BUSij) and Work efficiency(WEFij) have very significant relevance (p<0.000), financial management (FINij) has significant relevance(p<0.001) and organizational management(ORij) show significant relevance(p<0.05) to the Quantitative Score of the public firm. But social contribution(SCij) and welfare management(WELij) don’t show significant relevance.
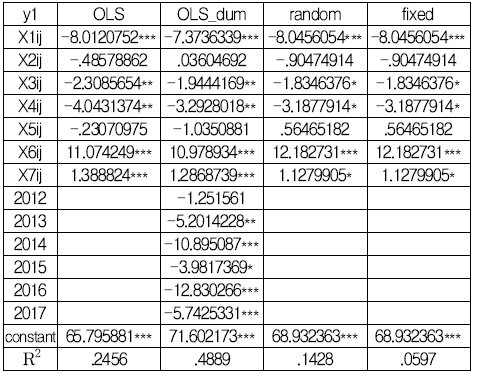
The panel analysis results between the financial rate· size and total Score(y1) by the OLS, OLS dum, random effect and fixed effect models are shown in Table 24.

Panel regression results for score by rate·size
The four panel regression models have R2 of 0.2456, 0.4889, 0.1428 and 0.0597, respectively, indicating that OLS and OLS_dum models are suitable. Among them, the R2 of OLS dum is the best analysis model with 0.4889. And, debt rate(X1ij), investment efficiency of total capital(X6ij) and size(sales)(X7ij) have very significant relevance (p<0.000), non-current rate(X3ij) and return on capital(X4ij) have significant relevance(p<0.001) to the total Score of the public firm. But current rate(X2ij) and turnover rate of total asset(X5ij) don’t show significant relevance.
The panel analysis results between the financial rate· size and grade by the OLS, OLS dum, random effect and fixed effect models are shown in Table 25.

Panel regression results for grade by rate·size
The four panel regression models have R2 of 0.3059, 0.4264, 0.1089 and 0.0802, respectively, indicating that OLS and OLS_dum models are suitable. Among them, the R2 of OLS dum is the best analysis model with 0.4264. And, debt rate(X1ij), non-current rate(X3ij), turnover rate of total asset(X5ij), investment efficiency of total capital(X6ij) and size(sales)(X7ij) have very significant relevance (p<0.000), return on capital(X4ij) have significant relevance(p<0.001) to the grade of the public firm. But current rate(X2ij) don’t show significant relevance.
4.5 Hypothesis test results
The results of two types of hypothesis tests by OLS_dum model(table 23-28) are as follows:
All seven types of Hypothesis I are acceptable. In other words, all seven types of management evaluation items are significantly related to scores and ratings and can be viewed as appropriate criteria. In Hypothesis II, the current rate(liquidity) was rejected and the total asset turnover(efficiency) was partially adopted. In addition, debt rate(financial safety), non-current rate(asset·capital adequacy), total capital investment efficiency(productivity) and sales scale were adopted as they appeared to be highly relevant to scores and grade. The return on equity(profitability) was also adopted because of its strong relevance to score and grade.
5. Summary and Conclusion
The analysis results of this study are summarized as follows.
First, the results of comparing the size and major financial ratios between the port firm and general public firms are as follows. From 2011 to 2017, the average number of executives and employees at the four port firms stood at 142, or 4.1 % of the average 3,459 employees at public firms. The average total assets are 2.723 trillion won for the four port firms, compared with 23.252 trillion won for the public I, 11.7 % for the public firm, and 14.4 % for the public II, 18.9524 trillion won for the country.The average sales figure is 147.8 billion won for the Korea Port firm, compared with 8.65 trillion won for the public firm I, 1.7 % for the public firm II, and only 4.6 % for the public firm II at 3.2177 trillion won.
However, the average debt ratio of the four port firms is 34.5 %, compared with 124.9 % for public firm I and 85.2 % for public firm II, which is two to three times lower. The average operating profit margin of sales is 28.1 %, compared with 9.8 % for public firms and 9.1 % for public firm II, which is three times better. However, the size of the port construction is so low that the value added is very small. In other words, the average value added by the four port firms is 141 billion won, compared with 30.656 trillion won for public firm I and 24.38 trillion won for public firm II, which is 0.46 % and 0.58 %, respectively. Therefore, the average total asset investment efficiency is 6%, which is only 0.6-0.2 of the public firm I (9.7%) and public firm II (24%).
However, the value added per person is 777 million won, which is 1.6-1.9 times better than that of Public firm I (496 million won) and Public firm II (413 million won).
Second, the T-test results between scoring and evaluation items between the four port cities and general public firms are as follows. In other words, the overall score is 76.19 for the Korea Port firm and 78.79 for the General Public firm, which is slightly lower but no significant difference. However, the non-critical score is 26.29 for the Korea Port firm and 34.8 for the General Public firm, and 51 for the Korea Metrological Index, but the difference is 45.02 for the General Public firm. As a detailed evaluation item, major projects show that port construction is significantly lower with 36.98 points for the port firm and 39.47 for the general public firm, and port construction is significantly larger with 6.05 points for the port firm and 5.14 points for the general public firm. Other evaluation criteria do not show significant differences. Meanwhile, although the debt ratio of the port firm is significantly better than that of the general public firm, the liquidity ratio, total asset turnover rate and total capital investment efficiency are significantly lower.
Third, the distributed analysis results by the sales volume of public firms show significant differences in overall scores, non-metering scores, metering scores, and grade, which have a significant impact on the management evaluation. The detailed evaluation criteria show significant differences between major projects and social contribution and benefit management. In the financial ratio, the gross debt ratio, the current rate, the operating profit rate of sales, the turnover ratio, the total asset turnover rate and the total capital investment efficiency are significantly different in size.
Finally, the results of the hypothesis test by the panel regression analysis show that seven types of management evaluation items are significantly related to the overall score and grade, so the current seven types of management evaluation items are relatively relevant. Among the major financial ratios, the liquidity ratio is not significantly related and the debt ratio, the non-current ratio, the profitability ratio, the total asset rotation rate and the total capital investment efficiency appear to be significantly related to the management evaluation. Meanwhile, since the sales volume has a significant impact on the overall score and grade, it is deemed necessary to supplement and improve the evaluation criteria. However, it is the limitation of this study and future research task that this study failed to present concrete alternatives for improving and supplementing key business indicators, as port volume is an uncontrollable factor rather than internal management capacity among measures to properly control the size effects or key project evaluation criteria.