Efficiency Analysis of Port Companies in China Using DEA and the Malmquist Method
Article information
Abstract
The efficiency of port operations is an important indicator of port development. Moreover, there is excess handling capacity in Chinese ports, which results in a slower speed of development. Under the detrimental environment of the international shipping market, it is necessary to improve the operation efficiency of ports for long-term development. This paper provides an assessment of the competitiveness of Chinese seaport companies using the Boston Consulting Group’s matrix, and efficiency measurements using a data envelopment analysis and the Malmquist method. This analysis showed that highly efficient companies reformed their development strategies, which should be a solution considered by less efficient companies, such as Shenzhen Yan Tian Port Holdings Co., Ltd.. Although, having high throughput should be reformed in the investment structure. This research will assist port companies in gaining effective operating experience, and governments in establishing strategic planning to enhance the efficiency of port development.
1. Introduction
Global trade portals rely on ports since more than 80% of global international trade uses maritime transportation; thus, the efficient port operation is an important indicator of economic development(Lin and Tseng, 2005). Evaluating port efficiency is essential to port operators, investors, governments, and customers to monitor port performance and to identify the critical factors that require improvement, such as trade competitiveness(Nguyen et al., 2016).
Based on the data of Ministry of Transport of the People’s Republic of China, in 2015, the total cargo throughput of China was 12.75 billion tons, although the growth rate was only 2.4%. This is a decrease in the performance growth of port companies from the previous year(5.8%). According to an annual report of 2015, the decline in performance growth experienced by most port companies was attributed to low-cost efficiency and a decrease in international trade(Jinzhou Port Co.,Ltd et al. 2016).
China's port companies have affected the country’s port industry and enterprises. Due to the opening-up policy in China, changes have occurred in the port companies such as the introduction of joint stock and local governments becoming port administrators. The ownership structure of port companies can be classified into four categories: state shares, legal entity shares, publicly tradable shares and employee shares. Currently, China has 16 port companies in the stock market. The companies received the support of the national government, and have the ability to raise funds from the stock market.
Jiang and Li(2015) analyzed the relationship between the ownership structure of the port companies and operational performance. They selected 13 port companies that were listed on the Shanghai and Shenzhen Stock Exchange. In 46.2% of the companies, the maximum possible stake was greater than 50% which meant that the ownership concentration of Chinese port companies was relatively high. In another study, Ju and Liu(2015) found that the ratio of state-owned shares, debt asset ratio and operating costs ratio was negatively related to the efficiency of Chinese listed port companies. From these two studies, it can be concluded that ownership concentration is high in Chinese port companies, and state-owned shares have negatively affected the industry.
Despite the importance of port companies in China, little research has been done on the ownership structure and the factors that influence efficiency. A quantitative method analyzing efficiency using major factors on the 16 China's listed port companies were not observed in the literature. Thus, to fill the research gap, the aim of this research is to analyze the operational efficiency of the port companies in China.
This research used the Boston Consulting Group (BCG) matrix to assess the competitive ability of Chinese port companies Data envelopment analysis (DEA) was used to provide efficiency measurements and the Malmquist method was used to assist port companies and governments with strategic planning and to enhance the efficiency of port developments.
The paper is organized as follows. Section 2 briefly presents a review of previous studies. Section 3 explains the basic concepts of the BCG matrix, DEA-BCC, CCR and the Malmquist method. Section 4 provides an assessment of the efficiency ratings for the 16 listed port companies in China and an analysis of the results. Section 5 presents the conclusions of this research and provides suggestions for future studies.
2. Literature Review
A number of studies have used the BCG matrix to evaluate port competition, which is defined as “acquiring trade in specific traffic categories, with port operators (and their terminals) as the main actors engaged in this competition and with port authorities as supporting actors opportunities for—and imposing constraints on—the port operation directly and on the broader port cluster indirectly” (Haezendonck, 2001, p. 14). It is crucial that port authorities operate ports competitively and understand current strategic positions in the market to develop strategies to maintain or improve competitive positions based on each port’s specific advantages (Han, 2002). Studies that provide these types of data include Pham et al.(2016), who analyzed the competitive positioning of container terminals in the northern region of Vietnam between 2005 and 2014 by applying the BCG matrix, and Han(2002), who analyzed the competitive positions of 11 Asian container ports using a strategic positioning analysis introduced by the BCG.
Table 1 is the result of summary about literature review. Some studies on port efficiency have applied DEA for Chinese ports(Kuang, 2007;) however, these researchers were conducted before 2010 and do not provide updated datasets that reflect current port efficiency. Kuang(2007) used the cost efficiency appraisal index system of public scientific port companies, in which net values of fixed assets, labor, and principal business costs were inputs and operating income, net profit, earnings per share were the outputs. Then, a CCR-DEA model was used to measure the cost efficiency of 13 port-listed companies in China. According to Hwang’s research, Kim et al. and Bang et al. also used DEA to measure container terminal companies and global ocean carriers. Lin and Tseng(2005) selected container gantry cranes, container quay length, stevedoring equipment, and container yards as inputs and container throughput as output to measure the efficiency of 27 international container ports. Park(2010) conducted an efficiency analysis of transport logistics companies in South Korea using the number of equipment, warehouse, and employees as inputs and sales as output for DEA method.

The selection of input and output indicators from related researches measuring the port efficiency
In this paper, cost and assets were chosen as inputs and income were chosen as output for the DEA. According to the previous literature table 1, assets and the number of employees were the most widely applied factors for input and sales or income were most commonly used for output. Thus, assets and income were also applied in this research. The core business of the listed companies is port operations, which are directly related to enterprise production efficiency, and the cost of business directly reflects how much the port-listed companies invested in the ports.
In addition to researching input and output capacity, market positions were assessed for planning future development strategies using limited resources. Applying the DEA model and BCG matrix to each port provided a complete interpretation of port efficiency. For example, Park (2006) showed competitive positioning trends for 26 Korean ports in 1994, 1999, and 2003 using the BCG matrix and CCR and BCC efficiency scores. Similarly, Bao Jiang et al.(2008) used the DEA and the BCG matrix to measure 12 container ports’ efficiency and competitive positioning in three countries (China, Japan, and Korea) between 2001 and 2007.
3. Methodology
3.1. BCG Matrix
The BCG matrix is an optimal tool for assessing competitive positioning (Haezendonck et al., 2006) because it takes into account the actual industry market share for each business, as well as related growth rates, to aid decision making related to cash flow and profitability (Hax and Majluf, 1983). Figure 1 shows how the BCG matrix distinguishes between four market positions: “question marks” imply significant future potential of terminals in terms of growth with uncertain market share; “stars” indicate significant future potential; “cash cows” indicate a currently strong market lacking long-term development potential; and the “dogs” imply few or no prospects for further development.
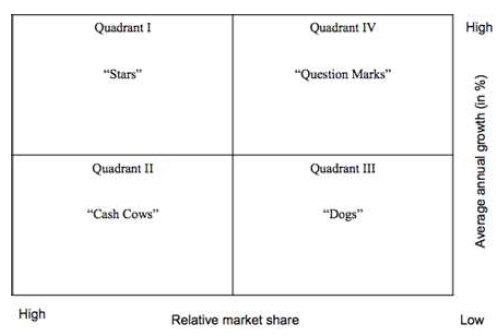
Boston consulting group (BCG) matrix
3.2. The DEA
The DEA analyzes industry efficiency using input and output variables to calculate efficiency and productivity for decision-making units(DMU). It includes the CCR and BCC models. In 1978, Charnes, Cooper, and Rhodes established the DEA-CCR model, which assumes the constant return to scale (CRS), which is determined by dividing the sum of weighted scores for input variables by the output variables. The CCR model can be calculated using the following equation.
This model has some constraints. First, the ratio of the sum of weighted scores for the input variables and output variables should not be more than 1; however, weight scores for these variables must be more than 1. Thus, most efficient DMUs have a ratio index of 1. Additionally, the CCR cannot distinguish between scale effects and technical efficiency. To overcome this disadvantage, Banker, Charnes, and Cooper (1984) developed the DEA-BCC model, which assumes a variable return to scale (VRS). The BCC includes increasing, decreasing, and constant benefits of scale because it adds the function of CCR to the efficiency of the DMU (Koo et al, 2017). The second equation is used in the BCC model to calculate management efficiency without the effects of scale.
Similar to the CCR model, the most efficient DMU in BCC model has a ratio index of 1. If the BCC is more than the CCR for the same DMU, the economy of scale exists in the DMU. The CCR and BCC models are categorized as input-oriented or output-oriented. The input-oriented model measures the minimum input using input variables when output is fixed, while the output-oriented model analyzes the maximum output based on output variables when the input is fixed. Technical efficiency using the CCR model can be classified as a scale effect but remains the same in the BCC model. The following equation calculates scale effect.
3.3. Malmquist Method
The Malmquist productivity index was proposed to analyze spending by Malmquist (1953). Fare et al. (1994) expanded the Malmquist method using the DEA to calculate productivity changes over time. In the Malmquist method, an input is divided by an output because an output can be measured based on the inverse of the productivity index which is based on an input. The following equation is used in the Malmquist method and based on the input.
Equation 4 shows the level of productivity change during t and t+1 time to give total productivity. If the Malmquist index is more than 1, productivity is improved, and if it is less than 1, productivity has decreased. If Equation 4 is solved by different factors (factorization), it can be expressed as follows. The right term is the technical efficiency change and the left one refers to changes in technology.
The technical efficiency change index(TECI) includes the variables that contribute to productivity changes over time. If it is more than 1, input and output are efficient. The TECI is affected by inner factors. The technological change index(TCI) shows how technical changes contribute to productivity, and when it is more than 1, technical processes are not regressing. Outside factors, such as government policy, can affect the TCI.
4. Case study
Port company is a joint-stock enterprise which changed from the government department - the Port authority. Moreover, the port company does not equip with full operation over the whole port. For instance, Tangshan Port Group Co., Ltd, which is reorganized by Tangshan Port authority, consists of three districts. However, the company mainly takes operations on the major district-Jingtang harbor district. The scope of service includes not only shipping, port construction, loading and unloading, and storage, etc., but also the port commercial real estate, and even the investment in other ports.
There are 16 port-listed companies in China’s stock market that are managed by state-owned port authorities. These are the biggest companies and most representative of the industry in China.
Table 2 lists the 16 companies as DMUs used by the DEA, with 2015 operating costs, the number of employees and total assets of input items, and net profit as output items. To ensure accuracy, all data are from the annual reports of these listed companies.

Name of Port Companies and the abbreviation
To understand the competitiveness of these companies, the BCG matrix was used to measure relative market share and compound annual growth rate(CAGR). And table 3 is the result of static BCG matrix in 2015.

The result of static BCG matrix in 2015
In Figure 2, SG had the highest relative market share but the lowest relative market growth, while ZH was the opposite. This indicates that SG’s profit was very good but had no long-term development potential. Relying on huge throughput meant that SG had the highest relative market share of all ports in China. The low relative market share of ZH was due to vigorous government support and a high income due to investment from the Guangzhou power station in 2015, which ensured the company’s relative potential future. In addition to TS and SC, most of the companies were considered dogs because they had relatively few prospects for further development.
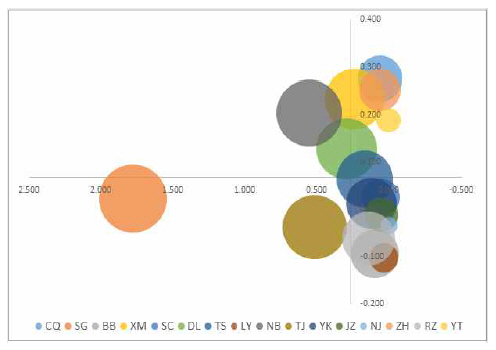
The relative market share and CAGR of DMUs in 2015
Table 4 shows the results of computing the 16 companies using the average and standard deviation. Investment increased, but from 2014–2015, annual income fell, indicating that overall cost efficiency was low.

Foundation Stats of 16 Port Companies from 2013 to 2015
The results given in Table 5 include, this paper not only measured the CCR and BCC models but also measured the scale elasticity(SE) and returns-to-scale(RTS). All of the scores that measured by DEA of XM, SC, TS, TJ are 1. They are only a quarter of the total number of the samples. Based on this, SG, NJ, and YT‘s annual BCCs were higher than the CCR, meaning an economy of scale existed in these DMUs. NB had an economy of scale efficiency in 2013 but was inefficient in 2014 and 2015. ZH also had an efficiency decline in 2015.

The Result of Efficiency Analysis from 2013 to 2015
Thus, XM, SC, TS, and TJ were constant because they scored 1 for CCR, BCC, and SE. Moreover, SG, DL, and RZ decreased in scale over the entire period according to the DRS. In case of BB, DRS was changed to IRS from 2013-2014 but was reversed again. NB and YK improved between 2013 and 2015. NJ had the lowest SE index, despite having a score of 1 in the BCC, because total assets and operating costs in 2015 were too large in comparison to the company’s net profit. NJ operates the Nanjing port, which is one of the most important river ports in China with highly developed traffic conditions, but it is limited by the Yangtze River’s depth and berthing capacity.
The throughput of the Shanghai port is operated by the Shanghai International Port Group Co., Ltd.(SG). Based on the data, the port had slightly higher costs than other ports. The BCG matrix analysis showed that the current situation is not sufficient for future development. The same factor affected the other companies, for which high scores indicate high costs. For example, ZH and CQ had a small market, lacked port infrastructure, and had imperfect logistics systems, but based on the BCG matrix, ZH had a strong return on investment with good future potential.
4.2. The Result of the Reference Set
Based on the DEA, a benchmark can be found for each DMU to show which input variables should be changed. To choose the suitable model for a benchmark, it needs to determine the relationship between input and output factors. In this paper, operating cost, total asset(Input) and operating income(Output) are related to returns to scale technology. So BCC model has to be a standard of the research. XM, SC, NJ, TS, and SG had three benchmarks. Table 6 lists the BCC scores and the lambda index for each DMU using the input-oriented BCC model.

BCC scores and Lambda index for each DMUs in Input-Oriented BCC model in 2015.
4.3. The Results of the Inefficiency Analysis
Using both the BCC method and DEA, the inefficiency index was analyzed for each DMU, which revealed that nine port companies were considered inefficient. The averages of the inefficient indices using input variables should be decreased by 11.54%, 19.06%, and 12.01% (Table 7).

Inefficiency by Each Variables
4.4. Comparing Efficiency Using the Malmquist Method
The Malmquist productivity index(MPI) more than 1 indicates improved productivity. A number less than 1 shows that productivity has decreased. Figure 3 shows the overall results of the Malmquist analysis.

Changing the productivity from 2013 to 2015.
All indices display a decreasing pattern, which indicates that the internal and external factors negatively influence productivity across the port industry. Considering the TCI, there was a technical regression between 2013 and 2015.
After analyzing the MPI, TECI, and TCI, many decreases were found for the DMUs. The MPIs for TJ and YT, in particular decreased rapidly (Table 8).

Malmquist Index by each DMUs.
For TJ, the TCI, not the TECI, changed from 2014-2015, indicating a sharp technical regression due to external factors. During 2013-2015, YT’s TECI shows the most significant changes and decline in internal efficiency, although its TCI showed an increasing trend. This means that the input and output variables for YT were inefficient compared to previous period.
5. Conclusion
As China's economy improves, the total volume of cargo handled by ports will increases. In this respect, port companies can have a significant impact on port logistics and port-related industries. However, there are few studies on the efficiency of Chinese port companies.
This study applied the BCG matrix, DEA-BCC, CCR, and the Malmquist method to analyze the efficiency of 16 port companies in China. The major findings from the analysis are summarized as follows.
First, the BCG matrix was applied to determine the relative market share and the CAGR. SG had the highest relative market share, but the lowest relative market growth, while ZH had the lowest relative market share and the highest relative market growth. Except for SH and ZH, the market competitiveness of the remaining 14 companies was relatively weak.
Second, The input-oriented DEA-BCC model was used to obtain the efficiency of the Chinese port companies. Most of the companies that had a low efficiency had different disadvantages. The highly efficient companies reformed their development strategies, which should be a solution considered by less efficient companies.
Third, the total productivity of selected port companies between 2013 and 2015 was assessed using MPI, TECI, and TCI. Many decreases were found for the DMUs. In particular, the MPIs for TJ and YT decreased rapidly.
This study offers several important implications for academia and industry. For academia, the implications are as follows: the market competitiveness of Chinese port companies was determined using the BCG matrix, which is a useful tool to identify the competitive positions of the current port companies; and various methods such as DEA-BCC, CCR, and the Malmquist method, were employed to find the efficiency of the port companies in China. The results of this study also have implications for the industry: the results give benchmark strategies to increase the port's efficiency, thus, companies with low efficiency can focus on critical factors to increase their efficiency; and the results suggest meaningful implications to port stakeholders who want to know the right situation of the listed port companies.
The study has the following limitations: a limited number of input and output factors were utilized due to the limitations of data accessibility in China, and comparisons between the port companies in China and other countries were not provided. Future studies should involve more critical factors and information to compare port companies in different nations.