

Introduction
Tropospheric anomaly can be caused by localized atmospheric conditions between reference stations in network RTK (real-time kinematic) environment, and it becomes one of the limiting factors for precise positioning(Ahn, 2007; Han, 2014). Inhomogeneous atmospheric conditions can affect the network solution and an imbalanced network error can degrade the correction message to rover station. It has been studied for the integrity monitoring and correction technique of high performance DGPS solution during tropospheric delay anomaly caused by localized atmospheric conditions (Cho, 2007; Kim, 2012; Seo, 2009; Shin, 2013; Yoo, 2011), and it is critical issue to detect an anomalous satellite that can degrade the correction accuracy during inhomogeneous atmosphere conditions in network RTK environment.
Atmospheric grid was introduced to detect the tropospheric delay anomaly during inhomogeneous weather conditions between stations. One atmospheric grid has four reference stations and each station can use the meteorological data from AWSs (automatic weather stations). The troposphere ZTD (zenith total delay) difference will be similar at four stations if there was no tropospheric anomaly. However, the troposphere ZTD between stations will be different if the atmospheric conditions are different at station. LPP (low performance point) is the most ambiguous position from four stations in one atmospheric grid. The troposphere SD (slant delay) projected an elevation at LPP depends on the troposphere ZTD at each reference station which means the localized weather conditions can affect the troposphere SD at LPP because the tropospheric delay at LPP is estimated using the meteorological data from four reference stations. If the difference of troposphere ZTD between stations (hereafter, delta troposphere ZTD) could be monitored, the tropospheric delay anomaly at LPP can be detected using the AWSs data.
AWSs data from 2006 to 2010 was analyzed for the threshold determination of anomaly detection algorithm. The meteorological data occurred imbalanced weather condition between stations from summer season was used to evaluate the anomaly detection algorithm. From the anomaly detection results, an anomaly flag was generated on the anomalous satellite and it was shown that the precipitation imbalance between stations can be the main factor that can cause the tropospheric delay anomaly and has strong relation on anomaly detection results.
Outline of atmospheric grid
2.1 Selected AWSs
In order to evaluate the proposed algorithm, the atmospheric grid consisted of the meteorological stations needs at least three stations, but it considered four stations that consist of one atmospheric grid. Korea meteorological administration (KMA) has a maximum distance of 100 km between the stations among over 500 AWSs(KMA, 2012). If the grid size is smaller, it is better to collect the meteorological data to estimate more accurate troposphere ZTD at LPP, which is the farthest point from all the stations assumed to be the most ambiguous point in the grid.
Fig. 1 shows one atmospheric grid consisting of four selected meteorological stations. The LPP is located in the middle of the atmospheric grid. Table 1 shows the longitude, latitude and the height data of the selected AWSs’ position with the station ID, which RS1 is Cheongju (Cheo) station, RS2 is Boeun (Boeu) station, RS3 is Jeonju (Jeon) station, RS4 is Buyeo (Buye) station, respectively. The atmospheric grid is within 100 km, and Daejeon (Daej) station is selected as the LPP. From the position of the LPP, two stations of RS2 (Boeu), RS4 (Buye) can be selected making an almost straight line from the LPP.
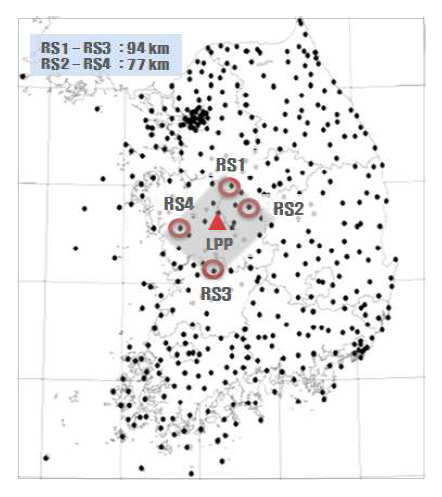
Table 1
AWSs' position
| Latitude | Longitude | Height | |
|---|---|---|---|
| Region | |||
| RS1 | N36.633° | E127.433° | 56.4m |
| RS2 | N36.483° | E127.733° | 173m |
| RS3 | N35.917° | E127.15° | 61m |
| RS4 | N36.267° | E126.917° | 11m |
| LPP | N36.367° | E127.367° | 62.6m |
Statistical meteorological data of pressure, temperature and humidity from 2006-2010 was gathered in order to obtain a daily mean data from AWSs, which are approximately 77km (Boeu-Buye), and 94km (Cheo-Jeon) apart from each other.
2.2 Threshold determination
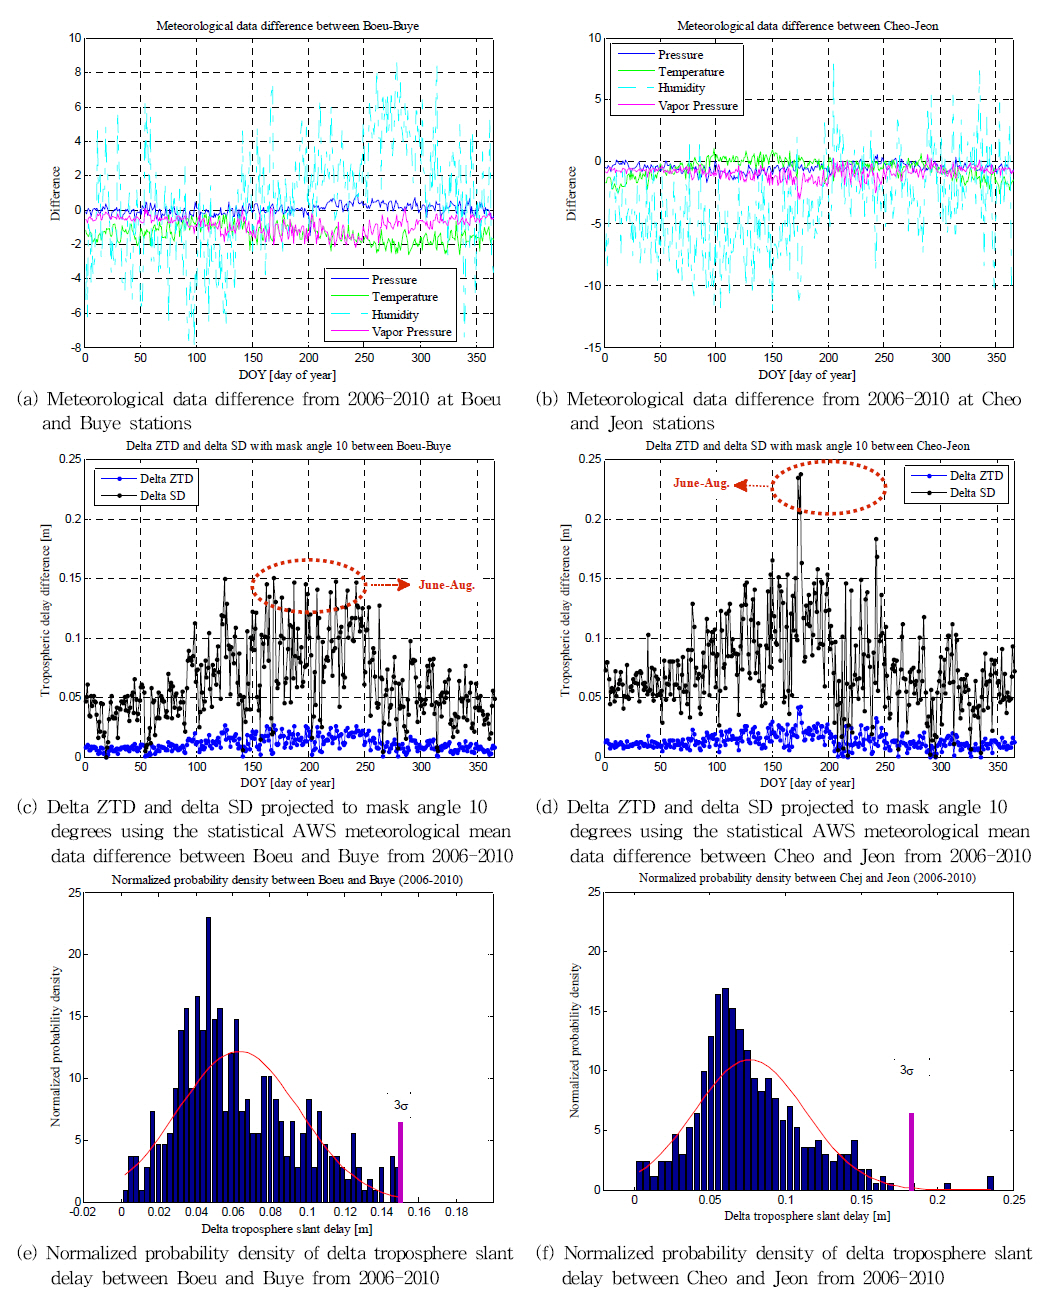
Fig. 2 shows the statistical data of Boeu and Buye meteorological stations. Fig. 2(a), (b) show the daily mean pressure data at Boeu and Buye, respectively. During the summer season from day 150 to 250, it shows comparatively low pressure below 1010 [hPa]. It demonstrates a similar trend at four sites all over the year. Fig. 2(c), (d) show the daily mean temperature and it indicates a high temperature around day 150 to day 250 during the summer season. Boeu station shows a lower mean temperature compared to the Buye station throughout the whole year in Fig. 2(c). Fig. 2(e), (f) show the daily mean relative humidity, and both results show high humidity around day 170 to day 280. Boeu station has a lower humidity around day 90 to day 130, and becomes higher around day 200 to day 300 compared to Buye station. Jeon station has relatively high humidity compared to Cheo station throughout the year.
Fig. 2
Statistical AWS meteorological data of mean total surface pressure (a) (b), mean temperature (c) (d) and mean relative humidity (e) (f) from 2006-2010 between Boeu - Buye and Cheo - Jeon stations

From the results of Fig. 2, the differences of meteorological data between Boeu-Buye and Cheo-Jeon are shown in Fig. 3(a), (b). In Fig. 3(a) the meteorological data of pressure and vapor pressure show a large difference around day 200 to 250. The temperature data has a large difference around day 250 to 350. In Fig. 3(b) it shows a significant difference of vapor pressure around day 175. Fig. 3(c), (d) show that the delta ZTD result and the delta SD result projected to a 10 degree mask angle of delta ZTD. During day 150 to day 250, comparatively high delta SD is shown, which has a large tropospheric delay difference between the stations. It shows a dominant peak of delta SD around day 175 in Fig. 3(d) same as Fig. 3(b). The normalized probability density results of delta SD in Fig. 3(c), (d) are shown in Fig. 3(e), (f). The probability density is shown to be the highest around 0.05m and the maximum value is 15.04cm within 3σ σ
Analytic results
3.1 Meteorological data of atmospheric grid
Four meteorological stations of KMA are selected. One meteorological station is selected as the LPP that is at Daejeon (Daej). This is almost near the position of the calculated LPP, among the AWSs to evaluate the detection algorithm with the actual parameter provided in real time from the KMA. For the evaluation of the detection algorithm during tropospheric anomaly in multi-reference station environments, weather data from four days was selected at two meteorological stations from Aug. 17 to Aug. 20 in 2010 during the summer season, which has frequent precipitation. The weather conditions for the selected four days are shown in Table 2. There is no precipitation during Aug.19-20 but there is precipitation at the LPP, RS2, and RS4 on Aug.17. However, Aug.18 shows different weather conditions at the LPP, RS2, and RS4. It has no precipitation at the LPP, large precipitation of 27.4 mm at RS2, and small precipitation of 0.4 [mm] at RS4.
Table 2
KMA weather (2010.08.17-20)
Fig. 4(a)-(d) show the meteorological data during Aug.17-20 in 2010 at Daej (LPP), Boeu (RS2), Buye (RS4), respectively. Fig. 4(a) shows the results of the total surface pressure, and it shows comparatively high surface pressure during Aug. 19-20, which has no precipitation. It is known that the temperature results of Fig. 4(b) and the humidity results of Fig. 4(c) show contrary changes to each other.
Fig. 4
AWS atmosphere parameter results of the total surface pressure (a), temperature (b), humidity (c), partial water surface pressure (d) data on Aug. 17-20 in 2010 at Daej, Buye and Boeu stations
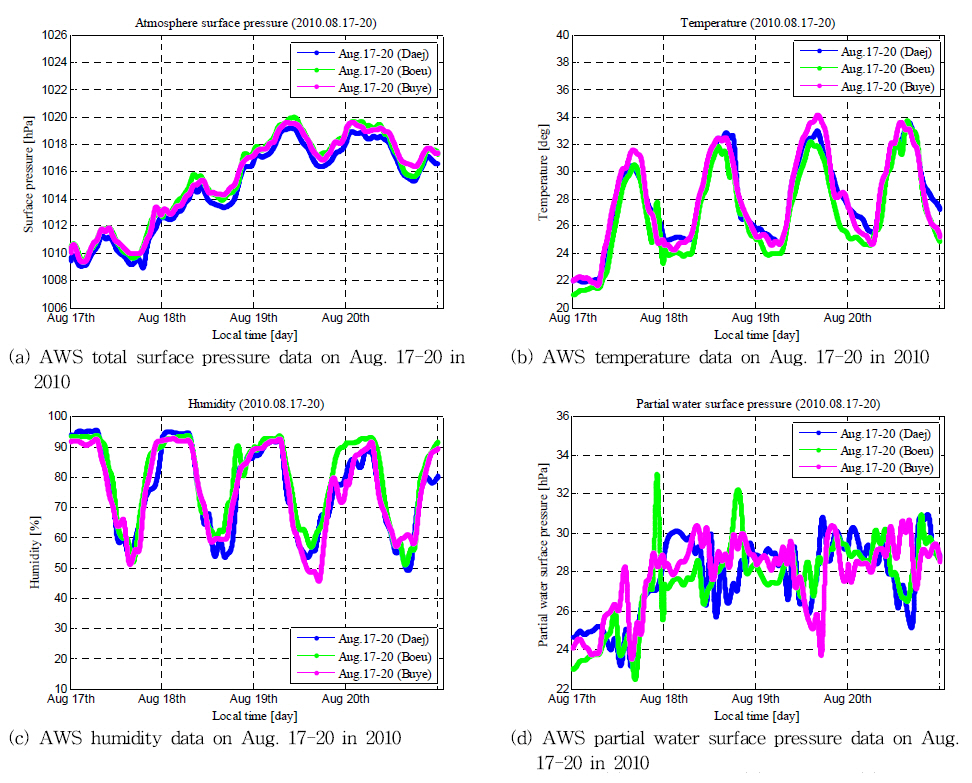
Fig. 4(d) is the partial water surface pressure using the temperature data of Fig. 4(a) and the humidity data of Fig. 4(c). RS2 (Boeu) shows the highest partial water surface pressure during Aug. 17-18.
Fig. 5(a) shows that the tropospheric ZTD regarding the 17-20 of Aug. in 2010 used the meteorological data in Fig. 4. The end of 17th and the beginning of 18th Aug. show high ZTD at Boeu station. It has 36.5 [mm] of precipitation on 18th as shown in Table 2. On the other hand, Daej station has no precipitation and Buye station has 0.4 [mm] of precipitation on 18th Aug. Fig. 5(b) shows estimated tropospheric ZTD with a red line of LPP and it used the ZTD results from two stations according to the distance from Boeu and Buye stations. The black bold line shows the measured ZTD results at Daej station. This can be compared with the estimated ZTD results at the LPP. Fig. 5(c) shows that the tropospheric ZTD difference at the LPP subtracted the measured ZTD from the estimated ZTD results as shown in Fig. 5(c). The end of 17th and the beginning of 18th Aug. show the largest tropospheric ZTD difference, which has a different level of precipitation as shown in Table 2.

3.2 Anomaly detection results
AWS meteorological data was applied to the detection algorithm for evaluation. The proposed algorithm can detect the tropospheric anomalies during the regional atmosphere anomaly. When Daejeon station is set to the LPP, two stations of RS4 (Boeu) and RS4 (Buye) are selected that have the most linearized formation from the LPP. Every minute’s meteorological data on Aug. 18 in 2010 was used for the algorithm for evaluation because the weather conditions (especially precipitation, which has the strongest influence on ZTD result) of RS2 (Boeu), RS4 (Buye) and the LPP (Daej) were most different on that particular day when compared to other days.
Fig. 6(a) shows the elevation angle at LPP of common satellites at selected two stations. PRN14 has the best visibility over 65 deg, and PRN09 disappears passed approximately 1100 epoch due to the mask angle. PRN09 has comparatively low elevation under 15 degrees. Fig. 6(b), (c) show the delta troposphere ZTD and delta troposphere SD results applied for every minute’s meteorological data regarding Aug. 18. Fig. 6(b) shows the lowest around 600 epoch and the largest around 1100 epoch with roughly -0.048 m and 0.042 m, respectively. It is known that the delta troposphere SD result is similar to the troposphere ZTD difference data of Aug. 18th at the LPP as seen in Fig. 6(c). Fig. 6(c) shows the delta troposphere SD results projected the delta troposphere ZTD to the elevation in Fig. 6(a). PRN09’ delta troposphere SD result is larger than the threshold that passed around 480 epoch, 500 epoch and 1100 epoch. PRN09 shows the largest delta troposphere SD and it has the lowest elevation in Fig. 6(a).
Fig. 6
Elevation angle of satellites at LPP (a), delta troposphere ZTD at LPP (b), delta troposphere SD at LPP (c)
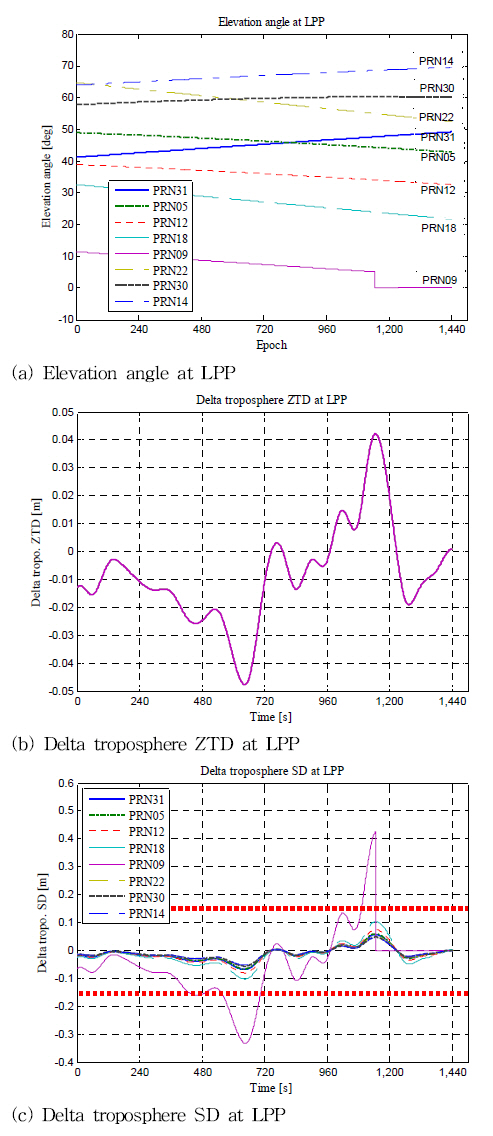
Table 3 shows the root mean square (RMS) result of the delta troposphere SD in Fig. 6(c). PRN14 has the lowest value of 0.0211 m, and PRN14 has the highest elevation over 65[deg] as seen in Fig. 6(a). PRN09 has the largest value of 0.1277, and it has the lowest elevation under 15 deg. PRN18 also shows a comparatively large value because it also has a low elevation compared to other satellites.
Table 3
Delta SD RMS results applied elevation at LPP
| RMS | Delta SD [m] |
|---|---|
| PRN no. | |
| PRN31 | 0.0273 |
| PRN05 | 0.0269 |
| PRN12 | 0.0331 |
| PRN18 | 0.0431 |
| PRN09 | 0.1277 |
| PRN22 | 0.0228 |
| PRN30 | 0.0225 |
| PRN14 | 0.0211 |
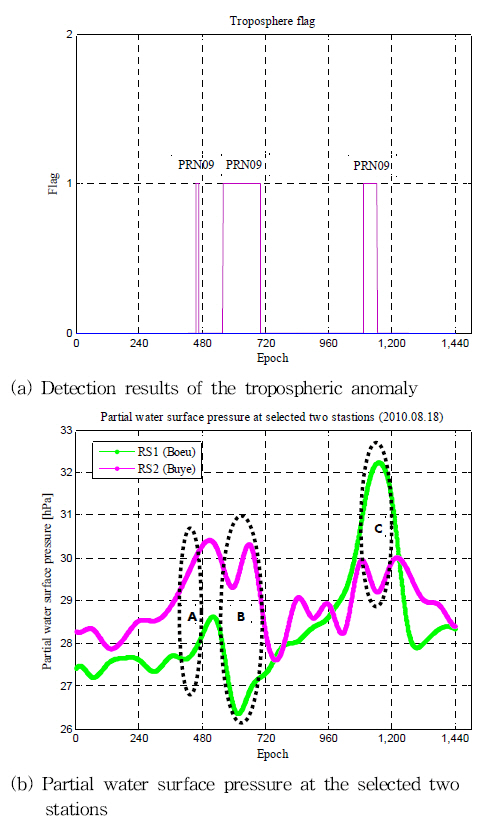
Fig. 7 shows the detected flag results and applied anomalies detection algorithm. PRN09 has an anomaly flag ‘1’ three times around 480sec, 500-700 sec and 1000-1100 sec. Since, the partial water surface pressure has a strong relation with the troposphere ZTD result as shown in Fig. 4(d) and in Fig. 5(a), the selected two stations’ partial water surface pressure data as shown in Fig. 7(b) is compared to the troposphere flag result as shown in Fig. 7(a). Detection results show a anomaly flag ‘1’ in A, B, C sections when the selected two stations’ weather condition (partial water surface pressure) has a large difference. Even though section C shows a large difference, flag shows ‘0’ in Fig. 7(a) around 1100 sec because PRN09 disappeared at that time in Fig. 6(c). Then, it is known that the proposed algorithm can detect the troposphere anomalies when there is a regional atmosphere anomaly using the multi-meteorological stations data.
Conclusions
It is known that the troposphere delay is one of the largest limiting factors for precise positioning and can cause additional degradation to the GPS receiver when an extreme localized atmosphere anomaly affects the tropospheric delay. Then, it is needed to implement the integrity monitoring of the GPS signal during a severe weather such as regional torrential rains or typhoon, etc.
This paper evaluated the proposed a detection algorithm for tropospheric anomalies using the multi-meteorological stations’ data of AWSs (automatic weather stations). The statistical weather data of AWSs for 5 years was applied to determine the threshold of delta troposphere slant delay between RSs within 3σ. The meteorological data from Aug. 18 in 2010, which has different precipitation at RS2 (Boeun station) and RS4 (Buyeo station), was applied to the proposed detection algorithm. An anomaly flag was generated on the satellite (PRN09) that has anomalous delta troposphere slant delay higher than the threshold. The proposed algorithm could detect the tropospheric anomalies during different weather conditions at RS2, RS4, and it is known that the different precipitation between stations is the main factor that causes tropospheric anomalies.
Even though it used the meteorological data of AWS (Automatic Weather Station) provided by KMA, it will be possible to implement a more accurate tropospheric anomaly monitoring technique if the atmospheric grid is small enough.
 PDF Links
 PubReader
 Full text via DOI
 Download Citation
 Print
Print


