A Basic Study on Marine Traffic Assessment in Mombasa Approach Channel-I
Article information
Abstract
Mombasa is the principle port of Kenya, serving inland countries in Eastern and central Africa. Mombasa port has undergone a massive infrastructure upgrade and dredging works with an expectation that more vessels and large post Panamax ships will be able to enter Mombasa port. Therefore, it is vital to carry out a marine traffic risk assessment in order to quantify the degree of navigation safety needed in the Mombasa approach channel and also to evaluate the navigation risk imposed on transit traffic by local ferry traffic. In this paper, a marine traffic risk assessment is carried out using the IWRAP mk2, Environmental Stress (ES) model, and the PARK model. Risk assessment results show that Likoni area has an unacceptable stress/ risk ranking at 20.7% by the ES model and 38.89% by the PARK model. The IWRAP mk2 model shows that the crossing area has the highest risk of crossing collision and the area at the entrance to the inner channel has a high risk of grounding. The conclusions derived from this study will provide the basis for proposing the most effective countermeasure to improve navigation safety in the Mombasa approach channel.
1. Introduction
The port of Mombasa is the largest port in East Africa and is the gateway to East and Central Africa and plays a very important role in facilitating trade and development in the region (Nyema, 2014). The port has strategic importance far beyond the borders of Kenya. It is the main gateway for the import and export of goods not only for Kenya but also for countries of the East African Community, the Democratic Republic of Congo, southern Sudan and southern Ethiopia (Kipkemboi, 2014). Statistics from Kenya Ports Authority (2014) shows that the number of ocean-going vessels arriving/departing at the port increased from 1,684 in 2011 to 1,832 in 2014. This amounts to 10% increase in ocean-going vessel traffic at the port. Part of the reason for the increase in traffic is due to upgrade of port infrastructure, operations automation and dredging of the channel that ended in 2012. Large post-Panamax vessels are expected to call at the port of Mombasa after dredging while the new container terminal is expected to raise the number of vessel traffic in Mombasa port significantly. Hence, there is a need to analyze the existing navigation risk on Mombasa channel so as to ascertain the level of navigation safety. Kristiansen (2005) defines safety as the degree of freedom from danger and that risk concept is used in evaluating safety. Kristiansen (2005) goes ahead to state that risk is often calculated for all relevant hazards, where a hazard is a possible undesirable event. In our case, we will focus on traffic accidents as undesired events. Park (1994) classifies collisions, groundings and ramming as traffic accidents. Up to date, there has not been any research work done addressing navigation risk assessment in Mombasa channel despite the fact that it is the major port in East Africa. Therefore, this paper evaluates navigational risk imposed on transit traffic by local ferry traffic using Environmental Stress model (ES) and Potential Assessment of Risk (PARK) model. This paper also uses IALA Waterway Risk Assessment Program (IWRAP Mk2 model) to determine collision and grounding frequencies at the port of Mombasa as recommended by International Association of Lighthouse Authorities (IALA). Results from ES and IWRAP mk2 model are compared with previous studies for Istanbul strait and Ulsan port so as to create awareness on the level of navigation risk. Five day AIS data collected in the period of 10 to 14 August 2015 was used in this study. The results from this paper will be the basis for further research in proposing a countermeasure to improve navigation safety in Mombasa channel.
2. Research Target Area
Mombasa is located at 4°2.5'S and 39°38.3' E (KPA Headquarters) on the East coast of Kenya. Mombasa approach channel is 7nm long divided into the outer channel and the inner channel. Outer channel is exposed to the sea and is 300m wide, 17.5m deep. The inner channel is sheltered waters 300m wide, 15m deep (KPA, 2014). The approach channel is marked by 10 buoys (IALA region A). Pilotage in Mombasa channel is compulsory for all vessels.
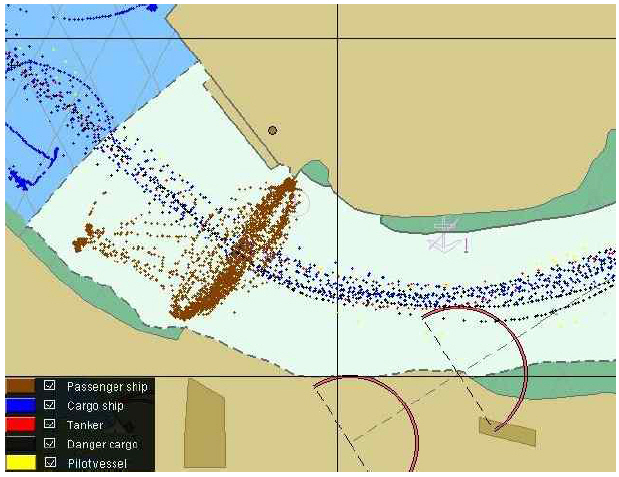
Figure 1 is showing geographical, hydrographic and navigational features of Mombasa approach channel. The bold arrows represent ocean-going vessels making headway into the port. The dotted arrow represents vessels heading to old port which is no longer in use due to its shallow waters, 11.2m deep.

Mombasa approach channel research area
3. Description of Marine Traffic Survey
Figure 2 shows vessel traffic track plotted from five day AIS data collected from traffic survey. Gate A was created to count the number of vessels entering/leaving the port of Mombasa during the period of traffic survey.

Traffic tracks based on vessel type from five day AIS data
3.1 Survey results of ocean going traffic
Observed traffic of ocean-going vessels is represented by the pie chart as shown in Figure 3. The majority of vessels calling at Mombasa port are containers, bulk carriers, and tankers. The ‘Others’ category consists of pilot vessels, dredger, and off-shore supply vessels.

Table 1 shows classification of vessels by gross tonnage as counted from gate A. It is observed that 57.5 percent of vessels calling at Port of Mombasa fall in the 20,000-50,000 gross tonnage category. Vessels occupying this category are classified as Panamax vessels. Therefore, it is acceptable to state that majority of vessels calling at Mombasa port are Panamax.

Vessel count by gross tonnage as observed from Gate A in figure 2
3.2 Survey results of Local traffic
Figure 4 shows local traffic tracks which consist of ferries that operate at Likoni Channel. The ferries are managed by the Kenya Ferry Services (KFS), a government parastatal, which owns a total of 7 ferries.
Ferry tracks at Likoni channel as observed from five days AIS data
The ferry is the only link between Mombasa Island and the mainland, handling 300,000 pedestrians and 5,500 vehicles daily (KPA, 2014). Figure 6 shows one-day observation of the ferries that was collected on 21 August 2015. Each ferry makes an average of four trips per hour on normal operations which take 5 minutes to cross Likoni channel and 15 minutes to load. On average the ferries makes 196 crossing per day in total. The peak times are from 0500hrs to 0900hrs in the morning when most citizens are heading to work at Mombasa central business district in the island and 1700hrs to 2000hrs in the evening when everyone is rushing back home as shown in Figure 6. At peak time, four ferries are operating at Likoni channel. The ferry in Figure 5 is 75m LOA, breadth of 16m, maximum speed across Likoni channel at 4 knots with a capacity of 1200 passengers and 25 vehicles.

The total number of ferries and total number of crossing frequency at Likoni channel per hour
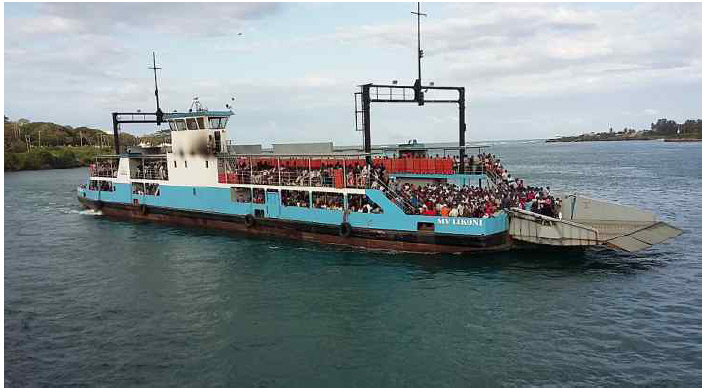
MV Likoni crossing Likoni channel
From the observations, it is evident that ferries pose as potential collision risk with transit vessels especially at peak periods of operation due to heavy local traffic. During the peak period, there is a ferry crossing the channel at any minute of the hour since four ferries operate at that time.
4. Marine Traffic Assesment
4.1 Risk Assessment by Environment Stress Model
Environmental Stress, ES model was developed by Japanese professors for risk assessment in waterways. It expresses, in quantitative terms, the degree of stress imposed by topographical and traffic environment on the mariner (Inoue, 2000). The stress value is calculated on the basis of time to collision (TTC) with obstacles or other ships. ES model was preferred because it is more convenient to express the navigational risk imposed on transit traffic by the local traffic in quantitative value. Transit traffic are the ocean going vessels that enter or leave the port of Mombasa while the local traffic are the ferries that operate at the Likoni channel as shown in Figure 7. The stress ranking is set up by classifying the range of stress values as 0 to 1000 (Park et al., 2002) as shown in Table 2.

ES stress plot of transit and local traffic at Likoni channel

Stress Ranking and Acceptance Criteria of ES model
Figure 7 is a real-time ES stress plot obtained from traffic survey at Mombasa. The track along the channel represents ESS plot for transit traffic while the ESS plot across the channel is for the ferries.
Table 3 shows the ESS index compiled for the region 39° 39.5'E, 4° 4.5'S and 39° 40.0'E, 4° 05.0'S from real-time traffic survey at Mombasa in the period of 10 to 14 August 2015. The ESS index is the stress value calculated on the basis of the time to collision with other ships. From the assessment result, Likoni channel has catastrophic stress at 17.5% in total percentage (transit and local traffic). The total percentage of unacceptable stress (‘catastrophic’ and ‘critical’ level) in Likoni channel stands at 20.7%, almost equal to most risky Sector A2 on Istanbul strait which has unacceptable ESS stress at 39.8% (Aydogdu et al, 2012). This is quite sizeable to declare Likoni channel as a high collision risk area thereby advising pilots to be cautious always when approaching Likoni channel.

Stress level as per traffic type in Likoni channel
The unacceptable stress level at Likoni channel can be explained by the fact that, there are ferries operating in this area and narrow channel which is 500m wide. These two conditions put stress on the mariner as the vessel approaches Likoni channel.
4.2 Risk Assessment by PARK model
Potential assessment of risk model (PARK) was developed by Korean research team in accordance with characteristics of Korean coastal area and seafarers (Nguyen et al, 2013). The research team divided elements that could affect marine traffic safety of a ship, as shown in Table 4, and thereafter the impact of each element was calculated by regression analysis. The risk of marine traffic safety of own ship in relation to a target ship is quantified by the ‘Risk’ value that is calculated based on the formulae (1). Stress ranking is defined as; 0≤Risk≤4 as “negligible”, 4<Risk≤5 as “marginal”, 5<Risk≤6 as “critical” and 6<Risk ≤7 as “catastrophic”

Elements affecting marine traffic safety of a ship
Park model was selected for assessment in this study owing to its advantage over ES model by incorporating internal and external elements of a vessel when calculating risk value. Figure 8 shows transit traffic risk values compiled for the region 39° 39.5'E 4° 4.5'S and 39° 40.0'E 4° 05.0'S from five days AIS data collected from traffic survey in Mombasa.
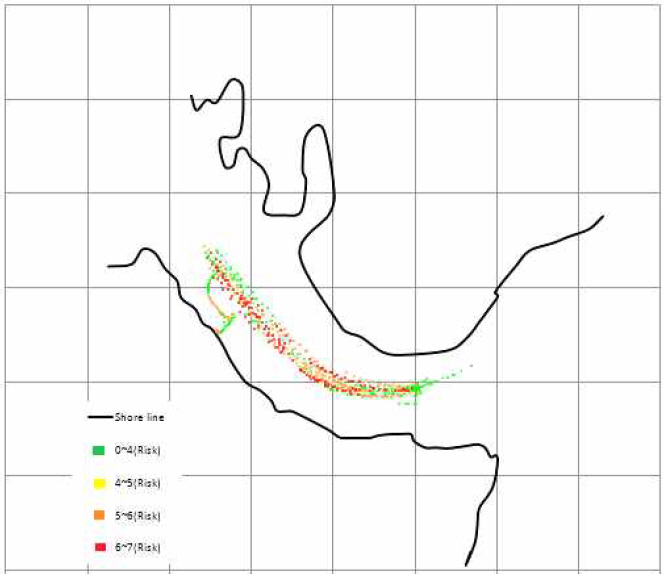
PARK model risk plot of transit traffic at Likoni channel
The risk values compiled were calculated with the help of Microsoft office excel program. Thereafter the risk values were calibrated based on CPA and TCPA between own ship and each target ship. In this case, only transit traffic risk values were calculated to ascertain the level of navigation risk posed on the transit traffic by the local traffic, in which ferries were treated as the target ship during calculation and transit vessels as an own ship.
From the Table 5, it is noted that Likoni channel has a catastrophic risk value at 12.19% for transit traffic, with the total unacceptable risk level (‘catastrophic’ and ‘critical’ level) summing up to 38.98%. This is because of the fact that Likoni channel is a high ferry traffic area with a narrow channel of 500m. Therefore, Likoni channel can be labeled as a high collision risk area for transit traffic.

Risk level of transit traffic as posed by the ferries at Likoni channel
4.3 Risk Assessment by IWRAP Mk2 Model
IWRAP mk2 program is a tool for the evaluation of collision and grounding probabilities by International Association of Lighthouse Authorities (IALA, 2009). In this study, IWRAP mk2 model is used in assessing collision and grounding probabilities in Mombasa channel. In IWRAP mk2 model the frequency of accidents is modeled by the following basic formula (2);
Where;
λ: Frequency of collision or grounding accidents.
NG: geometric number of collision/grounding candidates.
P: causation factor.
Geometric number of collision/grounding candidates and causation factors are modeled from MacDuff (1974), Fujii et al, (1974) and Pedersen (1995) models. IWRAP Mk2 program assumes the following default causation factors which are drawn from Fujii and Mizuki (1974) and McDuff (1974) observations as shown in Table 6.

Default causation factors of IWRAP Mk2 program
Traffic distribution was manually uploaded into IWRAP program after sorting AIS data collected during traffic survey by TOAIS (Total AIS) program, a program developed by Nguyen et al (2013) to pre-process AIS data as shown in Figure 9.

Vessel tracks, Legs and traffic distribution from TOAIS program
Each leg and waypoint traffic distribution, traffic direction and default causation factors were defined accordingly as indicated in Table 7. Depth curves were traced from an uploaded Mombasa port raster map as shown in Figure 10.

Traffic distribution in Mombasa channel as computed from TOAIS program

Legs, traffic distribution and depth curves on IWRAP Mk2 program
A Leg is the principal and necessary element for the safety assessment in IWRAP. Depth curves from polygon tool are used in grounding frequency calculation (Kim et al., 2011).
It should be noted that probability of head on collision was not included in our results because Mombasa approach is a one-way channel. From Table 8 it is observed that total groundings in Mombasa and Ulsan waterway are almost equal but powered grounding frequency in Mombasa is almost twice that of Ulsan. Region A, as shown in Figure 11, has the highest risk of grounding. The high risk of grounding is due to shallow coral reefs and large sand banks at the entrance of inner channel which are always exposed during low tide. There is a high risk of crossing collision at Likoni channel represented by leg 6 and leg 7 from Figure 11, due to heavy traffic from ferries crossing in this area. Leg 3 has a high risk of bend collision with predicted bend collision frequency at 0.007616 incidents per year. The total crossing collision frequency in Ulsan is three times that of Mombasa waterway.

Frequency of grounding and collision as calculated by IWRAP Mk2 Program compared to Ulsan

Assessment results from IWRAP Mk2 program
5. Conclusion
By collecting AIS data, traffic data and applying IWRAP mk2, ES and PARK model, the effect of local ferry traffic on navigation risk on transit traffic was evaluated, collision and grounding frequencies were determined. The results of the study are summarized as shown;
Likoni channel, where ferry crosses, has unacceptable total stress level of 20.7% from ES model and 38.98% from PARK model. Therefore, it is considered as a high potential collision risk zone for transit traffic.
Powered grounding frequency in Mombasa is approximately twice that of Ulsan waterway.
Crossing region, where local ferries operate, has the highest risk of crossing collision.
These conclusions form the basis for the need to carry out further research on countermeasures which will improve marine traffic safety in Mombasa approach channel. Speed limits, route change, buoy change/establishment, AtoN on buoy and separation line are few of countermeasures which will be proposed, studied and their effectiveness measured by suitable risk assessment model after which the most effective of the countermeasures will be recommended in the next research paper.
