


1. Introduction
Marine pilots come aboard ships to assist the masters in their safe navigation and maneuvering operations in port limits, which is the most risk-exposed area for ships. Not only the in-port limits, but pilots also start giving service in dense traffic areas and narrow channels on open seas. Deep-sea pilotage is a new and increasing demand of shipping companies and charterers where their crew have poor language skills, no experience in high traffic density areas, poor visibility, unfamiliar with local traffic, contributing to unsafe navigation(MCA, 2014). Marine pilots are highly qualified in local knowledge and ship handling which improves the safe navigation of the ships. The difference between the accident rate of piloted ships and ships without a pilot in the Istanbul Strait(Ulus├¦u et al., 2009; Istikbal, 2006) is significantly high and the piloted vessel had quite safe transit in the strait. This is evidence of how important those marine experts are for marine traffic safety and risk aversion.
Broadly risk refers to an imminent probability of a hazard and failure as well as its severity and duration(Gul and Guneri, 2016). Pre-estimation of risk before starting each operation becomes an essential requirement to remove uncertainties and loose preventing (Junkes et al., 2015). Like all industrial area risk assessment has an important role in maritime transportation to estimate the risk level and likelihood of potential hazards. Risk assessments are applied in many fields including maritime transportation to analyze, prevent, predict, and develop future strategies(Kulkarni et al., 2020). A generic assessment frame took place in maritime literature introduction of IMO(International Maritime Organization) FSA(Formal Safety Assessment) guidelines in 2002 and MEPC(Maritime Environment Protection Committee) circular. Guidelines aim to evaluate risk analysis in five steps; Identifying hazards, Assessing the risk, Controlling the risk, Cost-benefit analysis and Decision giving(IMO, 2002). Other than ship operators a similar generic risk assessment was introduced for the marine pilot organizations on risk management for pilotage operations(ISPO, 2015a; ISPO, 2015b).
Existing risk evaluations on marine pilot organizations by ISPO(International Standard for after the Maritime Pilot Organization) are generic and not type-specific for marine pilot occupational accident risk aversions. A literature review carried out regarding marine pilot occupational accidents indicates that organizations and academic research are mainly representing a statistical frequency only related to the marine pilot accident in the vicinity of ship freeboard(IMPA, 2019). Fall overboard accidents are horrific due to the high risk of death probability. In the best scenario, the person can be picked up quickly and will just get wet. However, the conditions are deteriorating quickly in the open sea. Once a person falls overboard rescue operations are challenging and sometimes impossible due to adverse weather conditions and visibility(Selmy, 2016).
Despite all dangerous occurrences, there is no effective risk assessment adopted for marine pilot occupational safety. The whole area covered where the marine pilot is at risk, which starts from the ŌĆ£marine pilot station buildingŌĆØ till reaching the ŌĆ£ships bridgeŌĆØ. The accident frequency and severity of injury/loss calculated to take preventive action and implementation by using FTA and ETA diagrams. In this context, the paper frame is constructed as follows. The introduction section presents the short form of the inventiveness of this study with a literature review. Section 2 introduces the methodology, and the section 3 explains and shows qualitative and quantitative risk analysis of marine pilot occupational accidents. In the section 4, conclude research and propose future studies.
2. Methodology
Risk analysis has played a key role in predicting, preventing, and mitigating the risk in the maritime industry and interest is growing(Goerlandt and Montewka, 2015). According to the Akyuz et a(2020)l., following assessments are commonly used in the maritime field are Hazard and Operability Study(HAZOP), Bow-tie method, Functional hazard analysis, Failure Modes and Effect Analysis(FMEA), What-if analysis, Consequences analysis, and As Low as Reasonably Practicable(ALARP). Moreover, bow-tie analysis includes a diagram of event development with root causes and mitigation factors which can perform a quantitative risk assessment(Crawley, 2021). While FTA is allowed to illustrate the wide range of causes and ETA for the outcomes of the event to calculate the probability of total hazard. Bow-tie enables to calculate probabilities by adopting fuzzy set techniques which are based on expertsŌĆÖ judgments aggregation. A conceptual framework of the integrated methodology is illustrated and a list of symbols and abbreviations is listed in Table 1.
2.1 Bow-tie analysis
Bow-tie is a proactive and reactive method. This feature helps risk assessors a complete visualization of the developing stages of an event which allows setting preventive measures for each node on the FTA part and consequences after the hazard occurred on the ETA part with mitigation measures of damage(Akyuz et al., 2020). An unlimited number of hazards and consequences can be visualized. Additionally, diagram dynamism allows new scenario implementation for future development inputs.
2.2 Consolidation of methodologies
In this section consolidation of methodologies is presented. Fault Tree Analysis and Event Tree Analysis are combined with known probabilities which are derived from records.
2.3 Forming FT diagram
Primarily TE is defined as an undesired injury for marine pilots, and apparent and hindering side causes are derived from historic accident records and literature reviews. Later a tree is constructed from TE to BE in relevant sequences and branches.
The research-based on records of accidents that occurred during marine pilot transfer at every stage while they are on duty. Search conducted with key words of a PL, accommodation ladder, combination ladder, pilot door, pilot cutter, marine pilot, embarkation, disembarkation, pilot ground and pier accident. Information gathering from October 2020 till December 2020. 500 case were analyzed related to marine pilot occupational accidents counted 399, incidents 48, near misses and non-compliances are 53.
Once FT diagram is constructed under the chain logic of the system, probabilities are calculated from accident records samples. The statistical method is a direct count of occurrences and basic events. The probability formula is used to calculate the probability of an event occurrence(Sahoo, 2015).
Where, P(BE) is the probability of a basic event ŌĆ£BEŌĆØ, n(BE) is the number of contributions of the root cause, n(F) is the total number of accidents, n(Y) is the total year of accidents.
2.4 Calculating the probability of an intermediate event
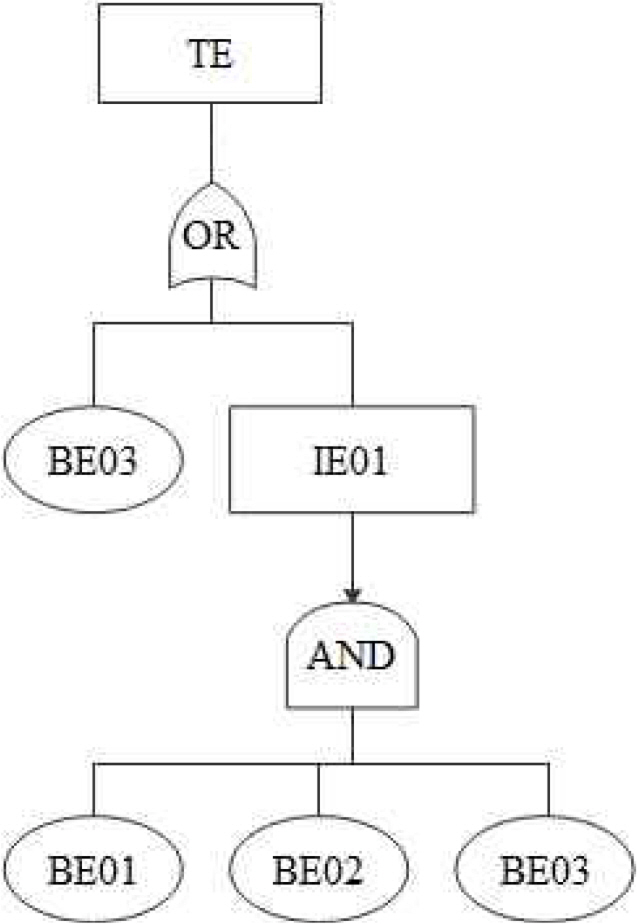
A basic FTA diagram is drawn for easy understanding of the calculation of IE and TE probability according to logic gate connections as Fig. 1. For instance, BE1, BE2, and BE3 are connected with AND gate.
The top event occurs after the success of either BE04 and IE01 through and or gate. IE01 is a failure and the probability of basic event BE04 is known.
The probability of TE is calculated by the above qualitative FTA method.
2.5 Calculating MCSs and total occurrence probability of TE
The FT diagram consists of multiple MCS which are the minimum number of BE combinations that lead to TE. According to the Andrews and Moss (2002), the MCS can be illustrated with the following equation (4).
The exact probability calculation of TE can be evaluated with the following equation (5).
P ( T ) = P ( M C S 1 Ōł¬ M C S 2 Ōł¬ ŌĆ” Ōł¬ M C S n ) = P ( M C S 1 ) + P ( M C S 2 ) + ŌĆ” + P ( M C S n ) - P ( M C S 1 Ōł® M C S 2 ) ŌĆŗ ŌĆŗ ŌĆŗ ŌĆŗ ŌĆŗ ŌĆŗ ŌĆŗ ŌĆŗ ŌĆŗ ŌĆŗ ŌĆŗ ŌĆŗ ŌĆŗ ŌĆŗ ŌĆŗ ŌĆŗ ŌĆŗ ŌĆŗ ŌĆŗ ŌĆŗ ŌĆē ŌĆē ŌĆē ŌĆē ŌĆē ŌĆē ŌĆē ŌĆē ŌĆē ŌĆē ŌĆē ŌĆē ŌĆē ŌĆē ŌĆē ŌĆē ŌĆē ŌĆē ŌĆē ŌĆē ŌĆē ŌĆē ŌĆē ŌĆē ŌĆē ŌĆē ŌĆē + P ( M C S 1 Ōł® M C S 3 ) + ŌĆ” + P ( M C S i Ōł® M C S j ) ŌĆ” ) ŌĆ” ŌĆē ŌĆē ŌĆē ŌĆē ŌĆē ŌĆē ŌĆē ŌĆē ŌĆē ŌĆē ŌĆē ŌĆē ŌĆē ŌĆē ŌĆē ŌĆē ŌĆē ŌĆē ŌĆē ŌĆē ŌĆē ŌĆē ŌĆē ŌĆē ŌĆē ŌĆē ŌĆē ŌĆē ŌĆē + ( - 1 ) n - 1 P ( M C S 1 Ōł® M C S 2 Ōł® ŌĆ” Ōł® M C S N )
(5)
The MCS, which are a combination of BEs, are used to calculate the probability of IE and TE in the conclusion. BEs is under laying causes of TE occurrence. If a single, BE or combinations of BEs become successful then the TE will occur. According to the Andrews and Moss (2002), the Fault Tree has MCS introduced by i=1,ŌĆ”.., n. In this scenario, if there is one MCS, it would be the TE ŌĆ£ZŌĆØ. In this context, the following equation (6) is used. The equation is valid only in certain limited conditions as each MCS is a independent variable.
In the equation, P(MCSi) gives the probability of the MCSi and N states the number of MCS.
2.6 Ranking the MCS
In the fault tree, each MCS will be having an important priority sequence. By ranking MCS reasonable preventive barriers can be determined to prevent and or less likely to occur of TE. Since in many risk models only one risk ranking could be sufficient most preferred to use Fussell-Vesely(FV) importance is used as a Risk Reduction (RR) measure(Meng, 2000).
In the equation,
I i V F ( t )
2.7 Constructing Event Tree diagram
ET formation begins after undesired events occur and expected hazardous event sequences are identified. Diagram branches continue to extend until all possible results are included with their likelihood and hazard level. An example quantitative calculation of outcome and its probability is illustrated in Fig. 2 and formula (8).
Therefore:
In the equation, P(n) gives the occurance probability of related outcome.
2.8 Constructing results of accident sequences
Once TE occurred other critical undesired events are triggered. In this step, the developing possible events are put in order according to their priority.
Ud-Din and Yoon (2018) asserted that the initial event is placed on the left corner of the diagram and possible outcomes are listed from left to the right in estimated sequences as illustrated in Fig 2. The steps of outcomes do not change the results or their probabilities but can be put in order as the logic diagram.
In this past step, possible and known failures are evaluated.
3. Analysis and Results
3.1 Numerical analysis
Risk analysis is a detailed examination of an undesired event (UDE) by answering what, who, how, and how often harm is caused. A comprehensive risk assessment will help the execution of transfer activities successfully and minimize the impact of the occurrence of injuries. Risk assessment combines qualitative and quantitative data of potential causes, impacts, and frequencies of undesired events, and the frequency(i.e., rate of accident per unit time) of occurrence is considered to calculate and estimate the risk. On the other hand, in the second part root causes are identified which helps to construct the fault tree with the consensus of world wide 26 marine experts who are marine pilots with marine navigational backgrounds. Table 2 shows general information of marine experts.
In first step, BEŌĆÖs are extracted from past accident reports and an initial tree constructed. After than tree and BEŌĆÖs explanations shared each expert and received corrections. In final step author edited and made best fit the BEŌĆÖs in the FTA diagram. Table 3 shows BEs, potential failures, which are selected with the consensus of marine experts.
Table 4 shows specifications of past accident records used in this study. A multi-source dataset with metadata of 500 accidents is created from the reports and worksheets are available.
The basic events are determined and presented to experts and FT has constructed the probability of events are calculated from accident reports as per events frequency in the total number of years and the total number of accidents. Table 5 shows occurrence probability of BEs from highest to lowest.
Based on constructed FT diagram with the consensus of marine exerts and logic flow defined in FT, the occurrence probability of TE (Marine pilot occupational accident) is calculated as 0.140. Table 6 shows MCSs, occurrence probabilities, and the V-FIM list of MCSs respectively. As a example, only top 10 most important event displayed due to page restriction.
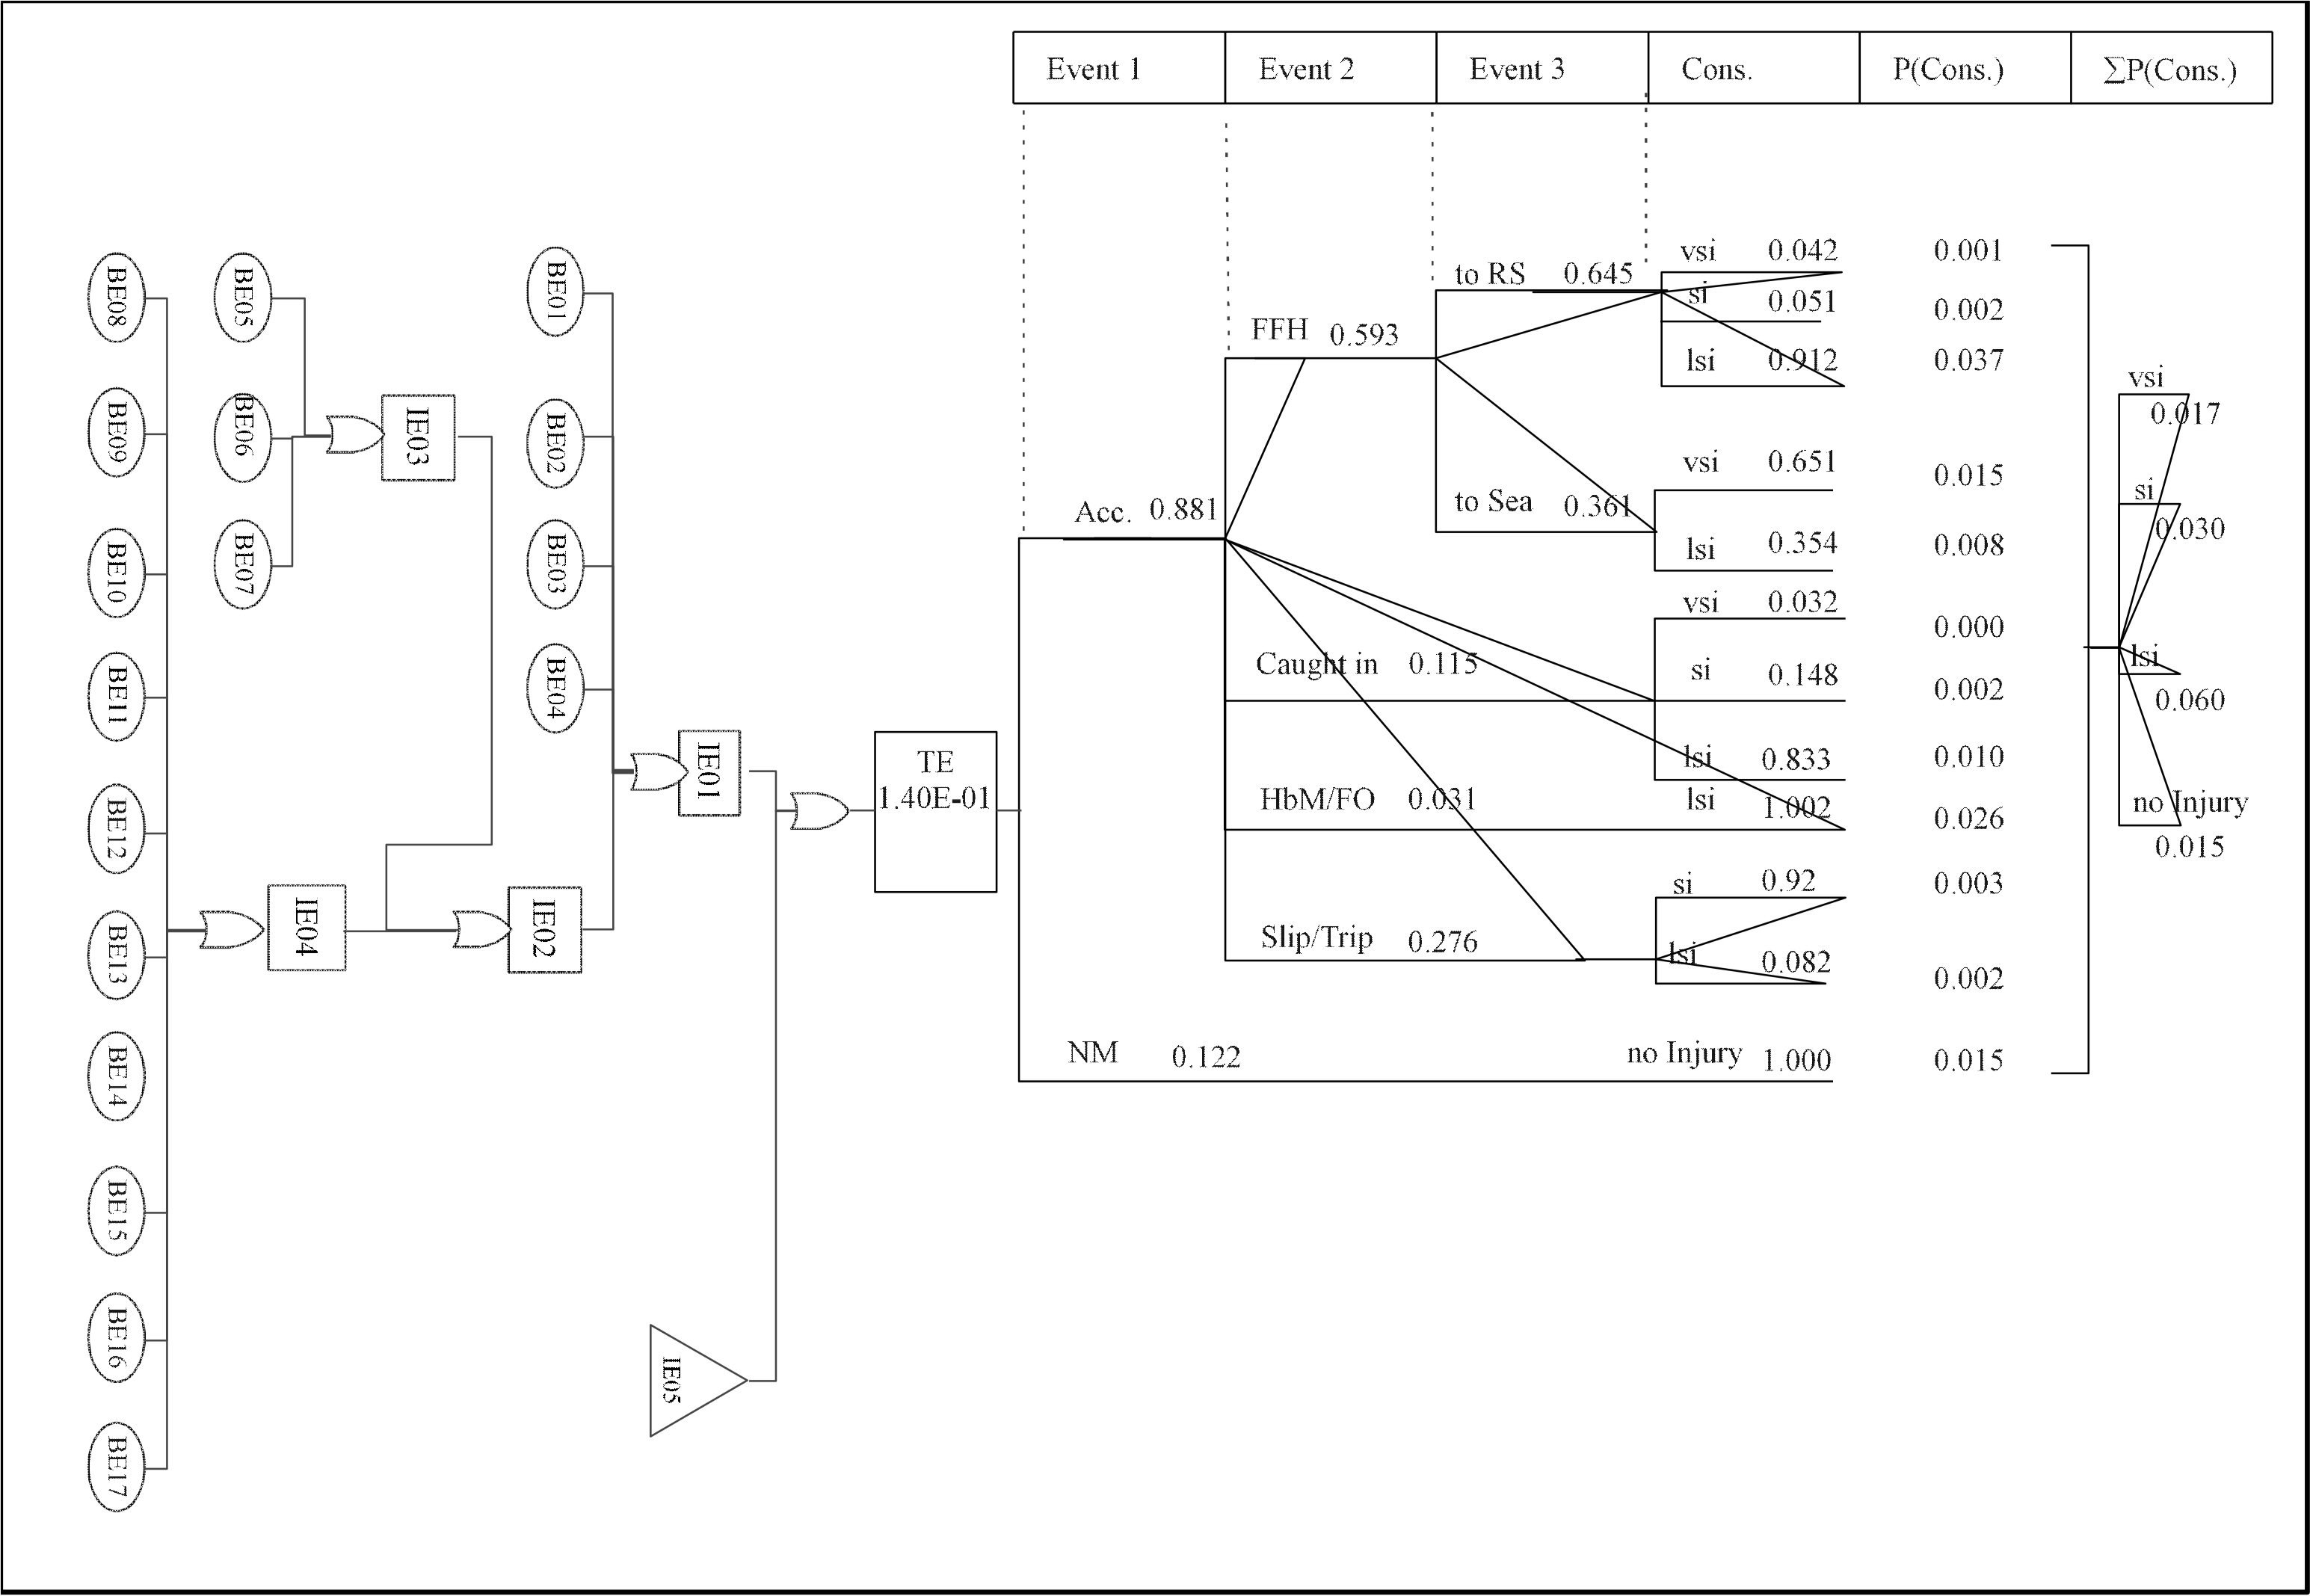
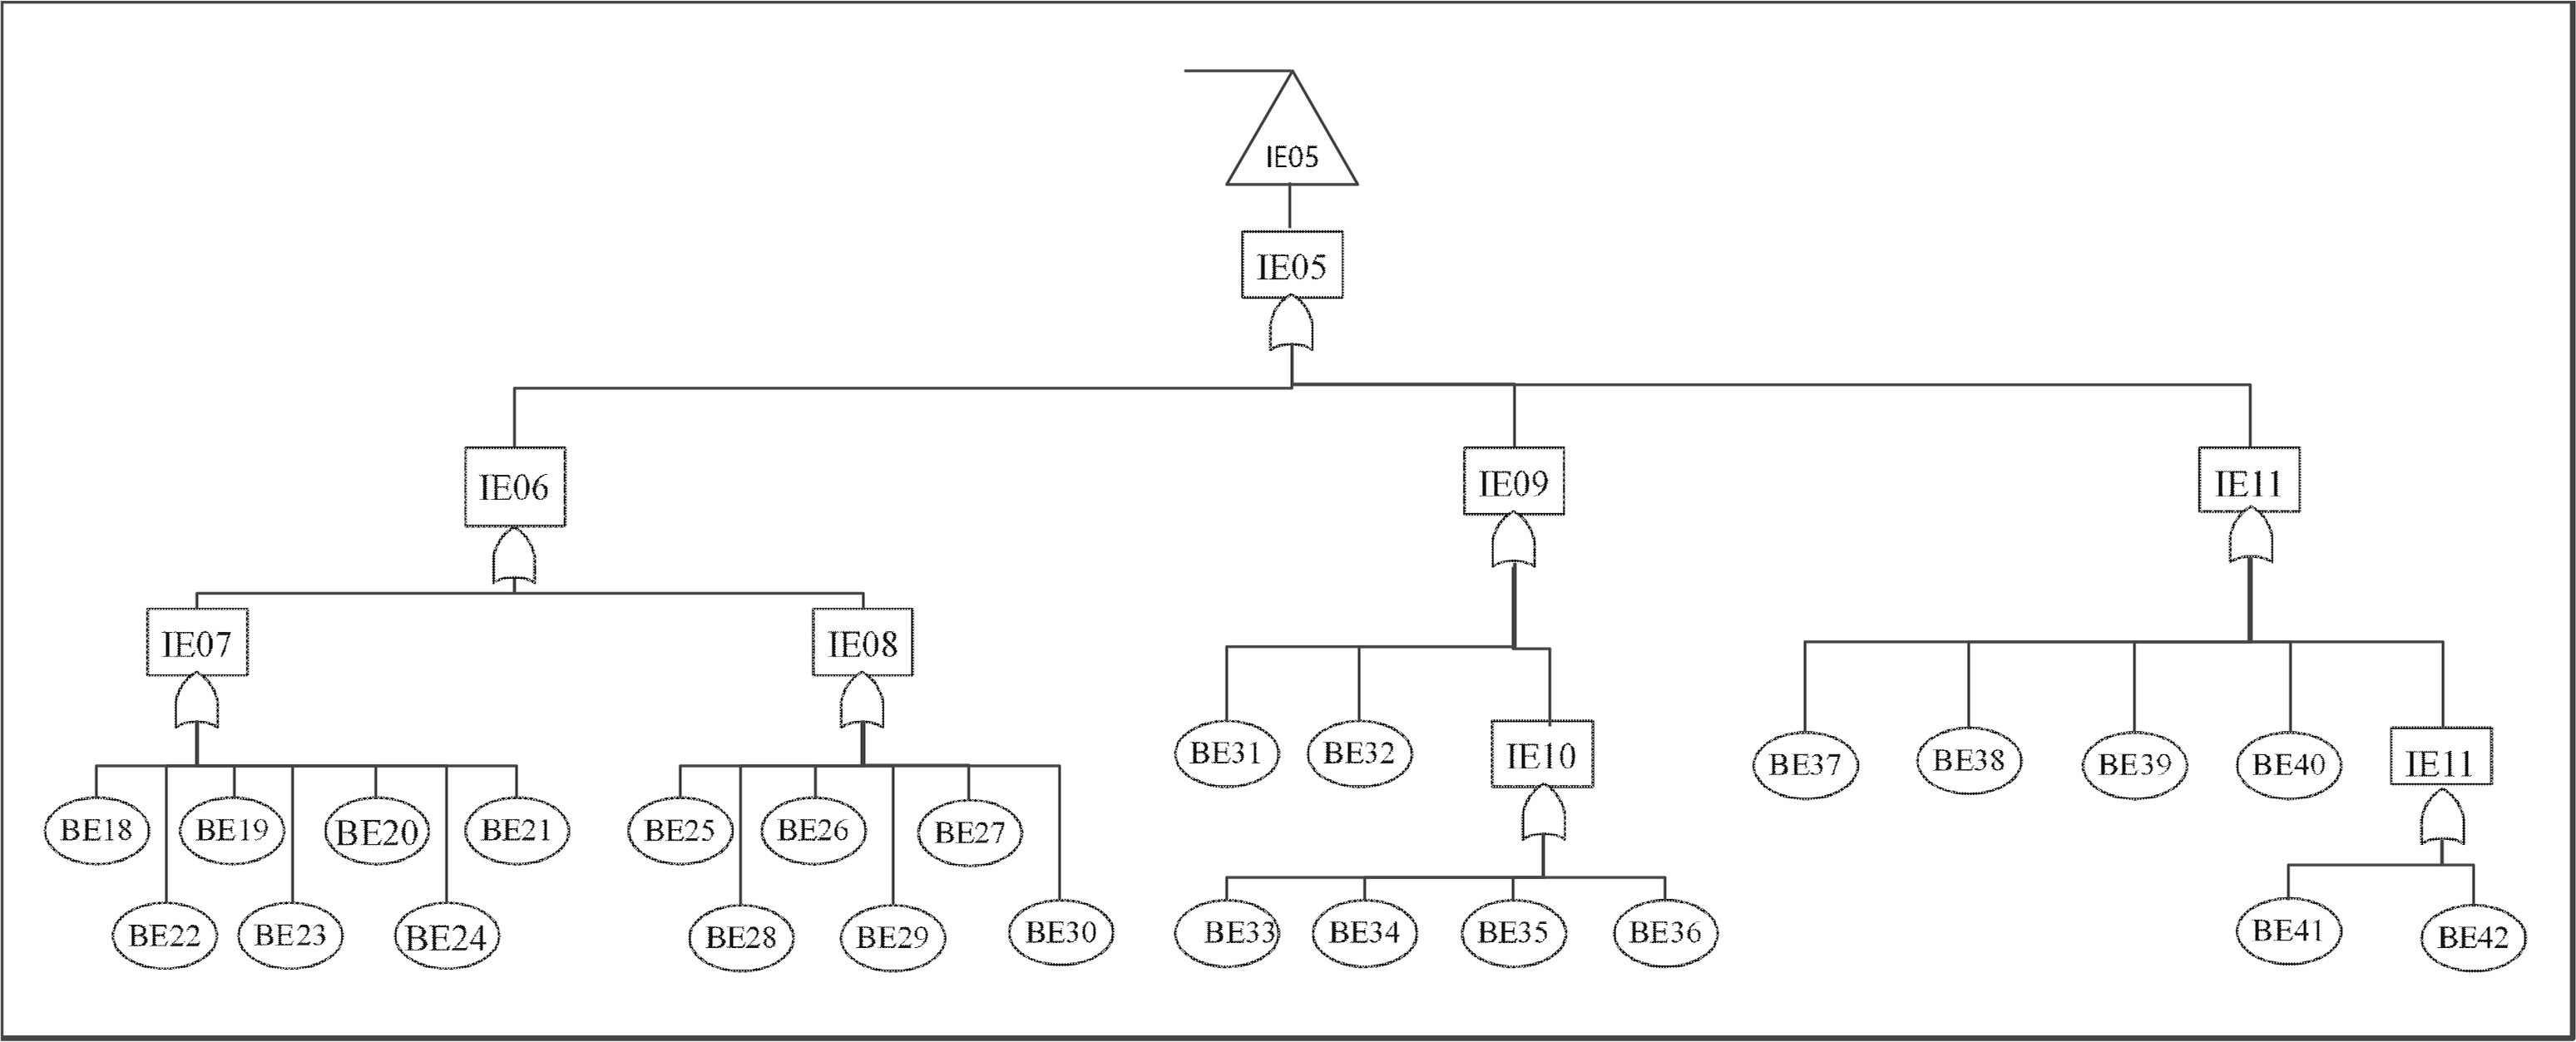
Once TE occurred and probability is calculated with MCSs, accident consequences analysis is calculated for risk assessment. ET diagram was also constructed with marine expertsŌĆÖ participation. The diagram shows developing event sequences and occurrence probability of marine pilot occupational accident consequences. Fig. 3 and 4 show the bow-tie diagram.
3.2 Results and discussion
After a large-scale risk analysis regarding marine pilot occupational accidents during their transfer, the accident arising probability was calculated as 1.400(14%). It means MP may have 14 accident at every 100 transfers case. In case human life and when considered those highly qualified people its significantly high. BEs are the main triggering components for the TEŌĆÖs success and receptiveness of the BEs are indicate the likelihood of TEs. As a result of calculations, BE01(Use defective non-compliant ladder and gangway) is found the highest probability to affect the accident occurrence. BE07(Failure to follow procedure, instruction and regulations) and BE05(Negligence of ship crew) follow as the second and third highest effects on TE.
The BE01(Occurrence probability: 0.031), use defective non-compliant ladder/gangway, is the significantly highest root cause arising marine pilot occupational accidents. Regulation 23 of Chapter V of the Safety of Life defines and describes the requirements of pilot boarding arrangements and equipmentŌĆÖs details, standards, and safety aspects(IMO, 1974). Those are the minimum criteria to be followed by ship crew and owners. However, there are various ship size, and type which makes those safety applications properly. Since MP transfer carries out in a harsh environment and his/her safety is highly linked with the transfer equipment compliance and maintenance conditions.
The BE07(Occurrence probability: 0.023), failure to follow procedure/instruction/regulations, is the second- highest effect on marine pilot accidents. Multinational ships call ports from all over the world. The seafarers on board the ship is from different educational backgrounds and training levels which led to a various understanding of safety aspects application. Once international standardization is misunderstood by ship crew abnormal application of pilot boarding arrangement preparations and rigging will occur.
The BE05(Occurrence probability: 0.019), negligence of ship crew, is the second-highest effect on TE occurrence. The shipŌĆÖs crew stay on board for a prolonged time. At the initial stage, newcomers are more likely to obey the rules and report any non-conformity. However, as time passes crew acclimatizes to the shipŌĆÖs environment which leads them not to recognize non-conformities and mis-behaviors. Normalization of deviance is very often seen onboard due to prolonged contracts and a harsh working environment.
On the analysis of the consequences, it can be seen very serious injury probability is calculated as 0.017 which is including permanent disability and fatality. When itŌĆÖs considered this model is applied only reported incidents probability of every 1,6 person in 100 is significantly high. On the other hand, injury over 3 days probability is 0.030 also respectively high.
4. Conclusion
Marine pilot transfer is highly dangerous work due to archaic method of embarkation methods. Solely trying to catch an unstable ladder and climbing on it up to 9 meters is a quite dangerous task. The system is exposed to environmental conditions and for this reason, itŌĆÖs vulnerable. That system safety depends on several independent factors. Such as ship crew, owner, and their safety understanding. While preparing transfer equipment they should consider that any little mistake which is not seen or ignored will cause a life of a human being. The expenses of those pieces of equipment are affordable for any ship owner and easily reachable. So, keeping equipment in good order and paying attention to simple international SOLAS and IMPA regulations will efficiently reduce MP occupational accidents.
On the other hand, vessel pilot arrangement design factors such as location, deck space for PL, overboard pipe location, fender arrangement, securing points, and sharp edges should be periodically reviewed for compliance. Ship crew might get used to their ships but as a third-party expert witness, MP can observe non-conformities and report to the shipowner and authorities for rectifications.
In this research trying to acquire accident reports was the main challenge. Either organization is not willing to share, or they donŌĆÖt have a proper record of the accident reports. Hence developing a reporting system and data base for each pilot associations will help for better accident analysis.
In a conclusion, this study aims to help pilot organizations to define and give a numerical value for root causes to estimate the risk level. On the other hand, once an accident occurred possible scenarios can be developed. In future studies, preventive barriers on the FT diagram and mitigation factors can be implied on the ET diagram to develop the model.

 PDF Links
 PubReader
 ePub Link
 Full text via DOI
 Download Citation
 Print
Print


