


1. Introduction
Spain is located on the Iberian Peninsula, with the longest coastline of 8,000 km among EU member countries and 90% of the ocean coastline. Spain’s per capita gross domestic product (GDP) was 1,247,464 in 2020 and 1,461,552 (US$ million) in 2021, increasing to 14th in the world (World Bank, 2021). The Spanish Port Management System comprises 46 general ports and 28 state-run port agencies. In addition, Spain is Europe’s second-largest country, with total throughput reaching 16.7 million twenty-foot equivalent units (TEU) by 2020, exceeding 70% of total container traffic in Spain.
Recently, the ports of Valencia, Algeciras, and Barcelona ranked in the top 10 in the EU-27 volume category. According to the national rankings, terminals operating in Valencia ports led the Mediterranean region and achieved 5.4 million TEU by 2020. The volume of the Algeciras-based Total Terminal International Algeciras (TTI-A) and APM Terminals reached 5 million TEUs. Further, as a logistics hub connecting ports and airports, Barcelona achieved more than 3 million TEUs.
Studies that analyze the efficiency of container terminals of the Spanish or even Iberian Peninsula territory under the above-mentioned individual characteristics are inadequate. Similarly, the number of recent research based on data envelopment analysis (DEA) methodology is considerably reduced, being addressed by hardly a few authors such as Gil Ropero et al. (2019), Parra Santiago (2020), and Fernandez et al. (2021).
Therefore, this study aimed to analyze the efficiency of Spanish container terminals, in an effort to provide an insightful guidance to the Korean container terminal industry. As ports continue to improve their automation levels, the performance methodology across different terminals and countries may vary drastically, which highlights the need of accurate study to address each terminal’s potential. To provide more exact data on Spanish container port efficiency, the study introduced the undesirable output variable. The Malmquist Index (MI) was also applied to assess temporary changes in productivity. Input and output variables were selected following previous studies for efficiency analysis. The study methodology used the CCR model, undesirable variable, MI, and DEA for static and dynamic efficiency analysis. The focus of the research was 17 Spanish container terminals, each one representing a Decision Making Unit (DMU). Efficiency was analyzed using Frontier and DEA-Solver Software.
This paper is organized as follows: Chapter 1 contains the introduction, Chapter 2 reviews prior studies implementing the DEA methodology, Chapter 3 examines the current status of Spanish container terminals, Chapter 4 describes the study methodology, and Chapter 5 describes the study findings. Finally, Chapter 6 presents the study’s conclusions.
2. Literarure Review
Over the past decades, the DEA methodology has been widely applied in many studies across different academic fields. For this study, research was dedicated to analyzing the efficiency and the performance levels of the Spanish seaport industry around the globe.
The DEA methodology assesses the efficiency of the overall homogeneous DMUs, in this case, container terminals. Typically, the total cargo throughput measure has been the primary indicator of productivity and port efficiency. Therefore, a considerable number of the study authors selected the input variables based on land use, equipment, or labor. Even though each DEA model has certain limitations, the model implemented varies according to the aim of each study; therefore, a substantial number of authors combine models in their research, as observed in Table 1. Nga et al. (2021) conducted an efficiency analysis of 16 container terminals in Hai Pong, Vietnam implementing DEA window analysis, DEA-CCR, DEA-BCC, and DEA-Super SBM efficiency analyses. The results suggested the possibility of improved terminal operation efficiency by increasing the number of quay cranes and labor. Shin et al. (2013) performed research through DEA-BCC and the DEA Directional Production Distance Function that considered undesirable output and CO2 emissions to analyze efficiency in two major Korean ports. Jung et al. (2020) assessed the efficiency of six major international ports in South Korea using the DEA-SBM model and the undesirable output analysis to identify the number of scheduled ships delays. In Nguyen et al. (2021), three DEA methodologies were followed; the elapsed time between container moves was the undesirable output variable in the analysis of 10 container terminals in Vietnam. These undesirable outputs were selected to demonstrate their negative effect on efficiency as its score increased, indicating excessive consumption of inputs, resulting in the inefficiency of the terminals.
In addition, the MI was included to evaluate the productivity fluctuations over time. Iyer and Nanyam (2021) in India and Wang et al. (2021) in Vietnam also implement DEA MI in their studies. Nguyen et al. (2019) evaluated 26 Vietnamese container ports using three methodologies to identify inequality among container terminals in various locations on the Cam River.
In addition, the MI showed the consequent gaps between the increase in technological changes and the technical efficiency change among the two coasts of the river. Under an analogous scheme, Zhang (2021) estimated the structural changes in 10 Chinese coastal ports, which presented an overall positive growth trend for as much as technological progress improvement.
There is a comparative lack of recent studies focusing specifically on the Spanish territory or the Iberian Peninsula. Martinez-Budria et al. (1999) conducted the first research on the Spanish port system implementing a DEA-BCC model. The authors presented a dataset of 26 DMUs corresponding to Spanish port authorities during five years (1993-1997). The variables selected for the model were oriented toward the financial efficiency improvement, therefore selecting inputs such as labor, depreciation charges, and other expenditures. The study concluded that a higher level of port complexity was directly related to a higher level of efficiency. Consecutive studies proposed the efficiency level results as an indicator of potential destination for financial investment. Medal-Bartual and Sala-Garrido (2011) applied a DEA model with tolerances to serve this purpose, segregating 28 Spanish ports by geographical areas. DEA Results showed Bahia de Algeciras, Bilbao, Valencia, Vigo, and Santa Cruz de Tenerife ports as leaders in cargo throughput movement management, thus designated as efficient ports. Gil Ropero et al. (2018) studied the efficiency rankings of 16 container ports in the Iberian Peninsula by implementing a DEA-BCC output-oriented model attending to input variables such as the number of cranes, terminal area, and dock length. Gokcek and Senol (2018) analyzed 28 container ports in the Mediterranean, including Spanish ports, by implementing, among others, output-oriented DEA-BCC and DEA-CCR approaches, which indicated that a higher level of efficiency was linked to a greater comparative competency. Results showed that Mediterranean ports in the East could expand their outputs using the same number of inputs. One of the first comparative studies to apply a DEA bootstrapping method on Spanish and Portuguese container ports was conducted by Gil Ropero et al. (2019) to analyze their operational efficiency in contrast with the DEA-CCR results. Approximately 62.50% of Iberian Peninsula container ports need to reduce their inputs to improve efficiency. Port connectivity with the capital city is highlighted as influential on the technical efficiency side, whereas managerial and strategic implications and targets are advised for the Spanish case. Following the same methodology, Parra Santiago et al. (2020) analyzed 46 Spanish port authorities. Fernandez et al. (2021) presented a DEA meta frontier analysis and a bootstrap approach to estimate the effect of a correlation between the impact of port containerization and port efficiency. The study showed that a higher level of containerization boosted and facilitated a port’s ability to enhance port efficiency.
Thus, the present analysis differs from previous studies focused on the Spanish territory as it is the first to combine the following methodologies: DEA-CCR, DEA with undesirable output and Malmquist analysis. An innovative output, the ‘Finish Time’ (undesirable output), which seeks to enhance the accuracy of the performance indicators is also unprecedently implemented. The available literature on this geographical area fails to provide up-to-date data on the performance of container terminals, in an effort to address this gap, this study includes recent data from 2018 to 2020.
3. Overview of container terminals in Spain
Located in the Iberian Peninsula, Spain has the longest coastline (8,000 km) among the member countries of the European Union, with 90% of its borders facing the sea (Mediterranean, Cantabrian, and Atlantic). Spain’s strategic connection to the main oceanic routes and the constantly upgrading intramodality achieved through rail corridors allow some of its ports to be considered hub ports, developing its role as the principal interoceanic liaison in Southern Europe. Maritime traffic importance in Spain can be observed through the country’s import (85%) and export (55%) volumes.
The Spanish port system comprises 28 state-owned port authorities with 46 ports of general interest and an infrastructure network of approximately 30 container terminals. State-owned public port authorities delegate their container services to private operators through public concession contracts to stimulate the financing of facilities construction and overall cargo handling services from private stevedore companies to enhance ports competitiveness. Heterogeneity is another factor that characterizes Spanish container terminals due to the differences presented among traffic types and equipment.
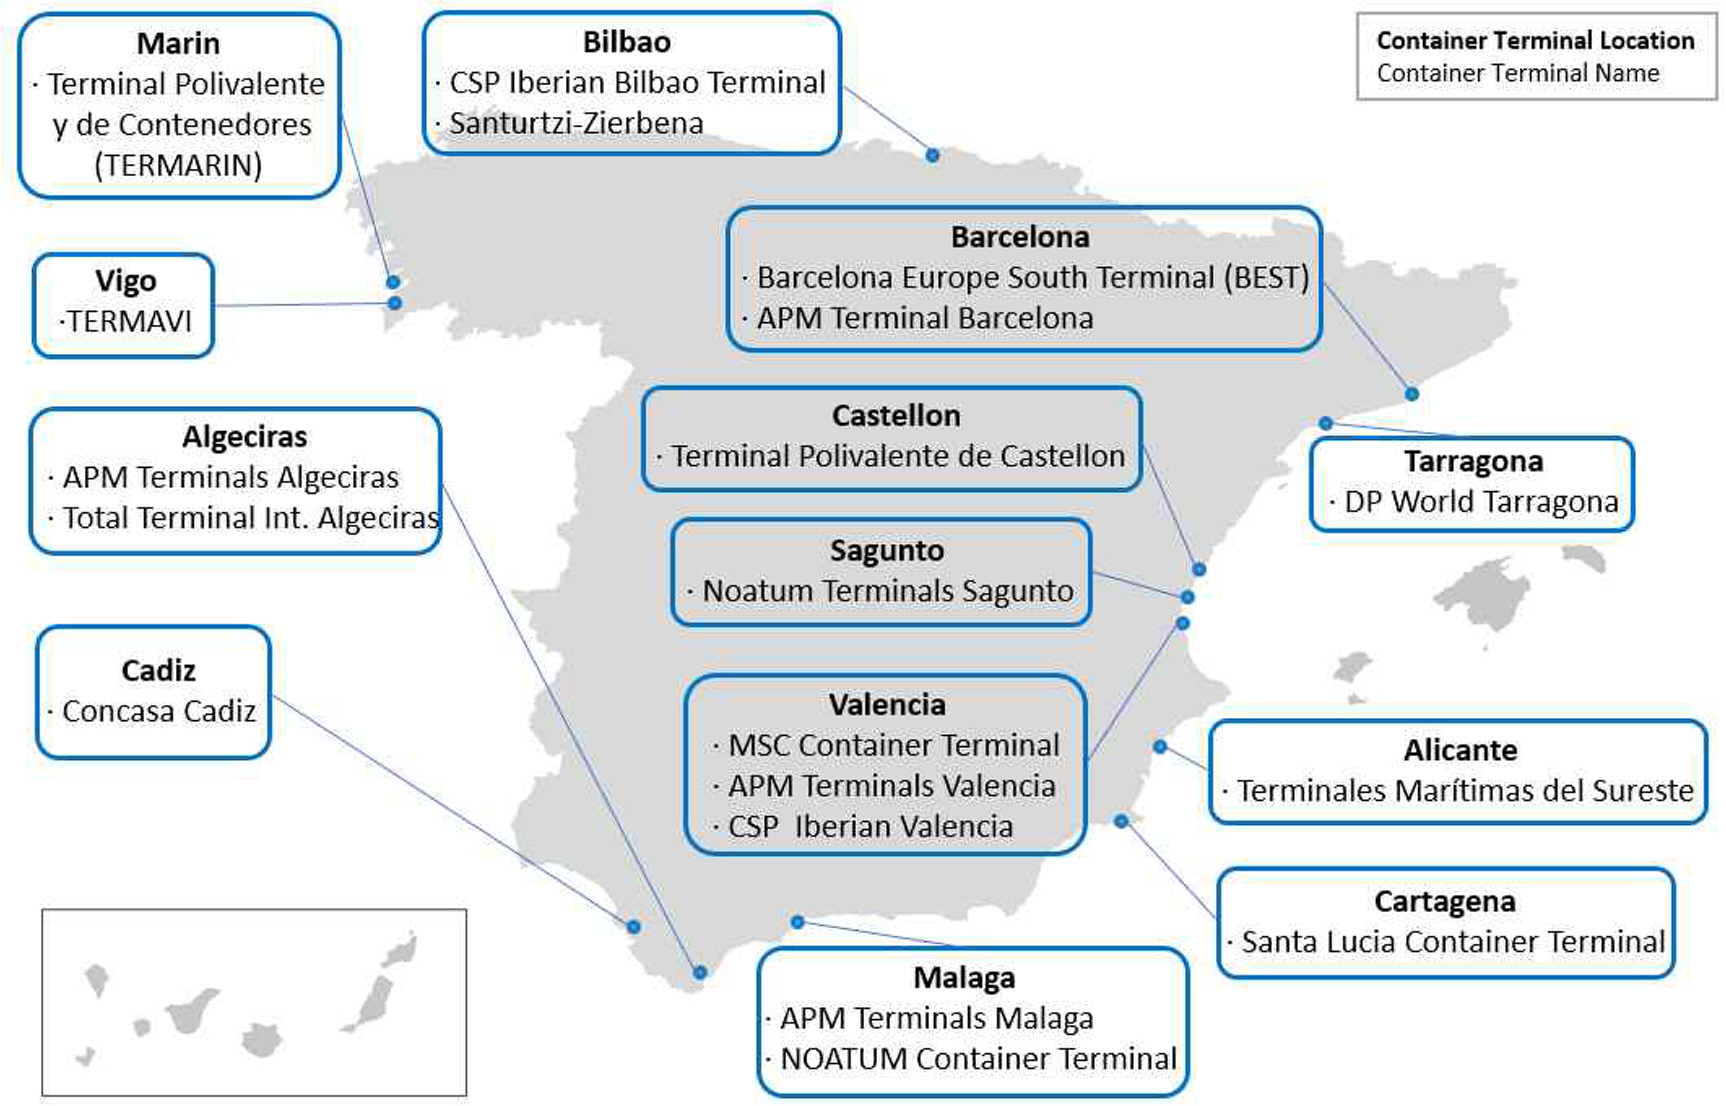
To handle the volume, Spain has maintained three ports in the top ten of the EU-27 for several years, as shown in Figure 1,. Valencia, Algeciras, and Barcelona. Spain is the second country in Europe in container traffic (TEU), with a total handling volume of 16.7 million TEU by 2020, where the containerized goods’ traffic volume surpassed 70% of the total goods in transit. According to the national ranking, the terminals that operate in Valencia’s port achieved a total handling value of 5.4 million TEU by 2020, leading the Mediterranean with intermodal accessibility to its hinterland and international connectivity. Container ports under the Algeciras Bay Port Authority, the TTI-A and APM terminals, reached a total value of 5 million TEU in light of its direct connection with 200 ports that link Asia with Europe and America as well as Africa with Europe. Contrary to the pre-pandemic tendencies, Barcelona Europe South Terminal (BEST), APM Terminals Barcelona and Camp Nou could not position Barcelona Port in a value higher than 3 million TEU. Barcelona port is the only logistical hub that connects the port, airport, logistical, and economic areas.
4. Methodology
DEA, initially developed by Charnes et al. (1978), is a methodology that calculates relative efficiency. This analysis is based on transforming the DMU inputs and outputs to identify the DMU with the highest efficiency through differences among decision units. This study implements DEA-CCR, undesirable DEA, and MI among DEA analysis methods to assess the efficiency of Spanish container terminals. This analysis targets 17 container terminals in Spanish ports, such as Vigo, Marin, Valencia, Bilbao, and Tarragona. Data from 2018 to 2020 were obtained and used for this purpose.
4.1 DEA-CCR
The DEA-CCR model was first presented by Charnes, A, Cooper, W. and Rhodes, E. L. (1978), aiming to compare and analyze the relative efficiency linear programming of the DMU assuming constant returns to scale (CRS). The equation used for the DEA-CCR model is presented below (1).
In Equation (1), E0 represents the efficiency score as the efficiency value of the DEA model. Based on (1), the closer the value is to 1, the more efficient the DMU, and the closer to 0, the more inefficient it is. Therefore, 1 is the value assigned to the most efficient DMU.
4.2. Undesirable DEA
The undesirable DEA analysis presented by Seiford, L. M., Zhu, and J. (2002) focuses on deriving efficiency. It considers unwanted output (undesirable output) and inputs and output elements covered in the basic DEA model.
Therefore, it is possible to find out changes in efficiency resulting from the undesirable output using comparing the difference between the result that does not include the undesirable output and the result in which it is included.
In addition, if an undesirable output occurs irregularly, the output is classified as an accident, delay, or cancellation. If it happens regularly, it can be divided into cases: harmful gas, wastewater, and defective products etc.
In the present DEA model, undesirable variables are considered reciprocal (hyperbolic measure). The DEA equation implementing undesirable outputs is shown in Equation (2) below.
4.3. DEA-Malmquist
The Malmquist Productivity Index (MPI) was first defined by Caves, Christensen and Diewert (1982). To obtain the MPI, the DEA analysis method was modified to estimate the difference by the period of productivity. The cause of the resulting productivity change was explained by dividing it into technological change and efficiency change. The MPI mathematical methodology is shown in Equation (3) below.
The MPI is the product of the technical efficiency change index (TECI) and technical change index (TCI). An MPI higher than 1 represents improved productivity, an MPI of 1 means productivity stagnation, and an MPI lower than 1 means reduced productivity. For TECI, a value greater than 1 means efficient input and output, where the increase or decrease is influenced by external factors. For the TCI, the increase or decrease of technological changes affecting productivity is influenced by external factors. A TCI greater than 1 means the technology is advanced; for values lower than 1, the technology might be interpreted as outdated.
5. Efficiency analysis of Spanish container terminals
This study aims to measure and compare the efficiency of 17 container terminals over three years (2018 to 2020). The study evaluates DEA for undesirable outputs and DEA MI approaches on selected Spanish container terminals.
The input and output variables and statistical information applied in this study are listed in Tables 3 and 4.
For this study, four input variables were selected: 1) container yard, the area where containers can be loaded in the terminal, 2) gantry crane terminal equipment for shipping and unloading containers along with berth length and depth measured in meters. Followed by an undesirable output variable, the finish time (O1), defined as the hours between last commercial lift and last line unberthing, and two ordinary output variables, the number of ship calls (O2) and container moves (O3), including discharge, restowage and loading moves.
5.1 DEA-CCR and Undesirable analysis
The following efficiency evaluation of DMUs is estimated using a DEA analysis, which includes desirable inputs and outputs and an undesirable output, the finish time. The undesirability of this output reflects a longer finish and a negative impact on the efficiency score.
Table 5 shows the results of DEA-CCR and undesirable analysis. According to the CCR analysis, DMU 1, DMU 2, and DMU 5 showed the highest efficiency among the DMUs, which scored 1.000 over three years (2018 to 2020) on both DEA analysis models.
Secondly, DMU 17 enhanced its efficiency between 2018 and 2020. It scored 0.637 in 2020, ranking 4th, and scored 0.546 in 2018, ranking 5th. DMU 14 was the 5th most efficient container terminal, although its efficiency progressively declined between 2018 (0.563) and 2020 (0.536). The DMUs above recorded an efficiency score over 0.500 during the entire study period.
DMUs with low efficiency scores (less than 0.500 or fluctuation) included DMUs 9, 10, and 11, reflected in the graphs shown in Figures 2 and 3. DMU 10 scored 0.275, and 0.577 in 2019, but declined to 0.279 the following year.
Container terminals with a large yard area have shown low efficiency scores in CCR analysis. DMU 15 showed only a slight improvement in efficiency, although owning the largest container yard area (1,450,000m2), scoring 0.210 in 2018, 0.288 in 2019, and 0.396 in 2020. In a similar case, the performance of DMU 4 was not as high in its terminal area (810,000m2) and volume (269,328 in 2018).
The highest efficiency DMUs had the higher number of moves, as seen in DMU 1, DMU 2, and DMU 5, which had equally high scores in both analyses. However, according to the CCR analysis, once the bad output was introduced, the rest of the DMUs’ values decreased in the DEA undesirable analysis results. The impact of the undesirable output was closely related to small container terminals, negatively affecting its ranking position.
As can be observed in Table 5, the results for both DEA-CCR and DEA with undesirable output analyses show a sharp decrease in 2020 compared to the previous years, which was motivated by the beginning of the Covid-19 global pandemic. From March 2020 the Spanish port authorities faced an unprecedent rise in blank sailings as well as restrictions affecting international mobility and type of cargo, therefore presenting a decrease in the number of calls (O2) and moves (O3). Containers remained idle in the terminal yards for several weeks, which also led to a relative increase in the finish time (O1). Although Spain was able to return to values close to those of 2019 as far as cargo throughput goes by the end of 2020, the fluctuability of this period had an undoubtable impact on the terminal’s operational efficiency.
Algeciras ranked 3rd position in calls and moves outputs. BEST is a multimodal semi-automated terminal responsible for the second-largest volume of calls and moves during the study period. It shows a mild decreasing trend between 2019 and 2020, in contrast with the previous 2018 increase, which might be related to the COVID-19 pandemic. It is worth mentioning that the average finish time, although fluctuating, was the second-highest among other container terminals, with a value of 1.65 hours for 2020.
Both APM Terminal Algeciras and BEST improved their terminals in 2018, with new cranes and rail yards, respectively. In the same year, TTI Algeciras added two new access doors to streamline operations. Therefore, despite the handling time, the primary reason for their operational efficiency might correspond to the influx of mega-vessels calls.
APM Terminals (Muelle de Levante) has maintained the 4th position since 2018, simultaneously reducing its finish time, reaching 1.10 hours by 2020. its efficiency score was not significantly altered during the studied period, closing 2020 with a score of 0.333.
The container terminals that experienced a higher rank in 2020 were APM Terminal Barcelona, CSP Iberian Valencia Terminal, DP World Tarragona (Muelle Andalucia), MSC Container Terminal, Cadiz City Basin, and Terminal No 2.
APM Terminal Barcelona ascended to the 5th position in 2020, with an efficiency score of 0.255. The terminal increased its transportation capacity and infrastructure by adding transport racks and new cranes in 2019, explaining the sudden rise of the efficiency score from 0.143 in 2018 to 0.249 in 2019. However, it also represents the highest finish time among the study objects, although it decreased from 1.71 hours in 2018 to ..66 hours in 2020.
CSP Iberian Valencia Terminal stands in 6th place by 2020, raising its 2018 ranking in 4 positions. Its score improved from 0.113 to 0.225, decreasing the finish time from 1.50 hours to 1.38 hours (2018 and 2020, respectively). The terminal has the second-largest equipment in this study, 17 Gantry Cranes. By 2019 the terminal implemented better railroad connections transferring its access doors to allow trains of 750 meters long for the loading/unloading of containers.
DP World Tarragona ranked 10th for 2020, increasing three positions in relation to the previous 2018 ranking. As of this date, the container terminal is undergoing an expansion and improvement plan, active since 2012. In 2019 new international shipping lines included DP World Tarragona into their commerce routes, leading to a gradual increase of calls for that year. The decreasing trend in 2020 might be attributed to COVID-19. In a similar case, MSC Container Terminal ranked 13th in 2020, escalated three positions.
Terminales Maritimas del Sureste, Santa Lucia (Cartagena Basin), and Cadiz City Basin maintained their rankings at 9th, 12th, and 14th, respectively, in 2020. In 2020, they faced reduced terminal activities as the volume of calls and movements decreased. On the other hand, the finish time increased considerably compared to previous years.
The terminals that dropped their efficiency performance were Santurtzi-Zierbena, Terminal Polivalente de Castellon, TERMARIN, Vigo Container Terminal, and Noatum Container Terminal.
The Terminal Polivalente de Castellon suffered reduced activities but increased finish time, placing it in a lower position (11th) in 2020 than previous years. In 2019, the Terminal Polivalente de Castellon faced a severe capital reduction by the maritime group Maersk, which assumed the entire shareholding of the terminal at the end of 2015. This was reflected in the unstable scores during the study period.
On the other hand, while the activities of Vigo Container Terminal fluctuated, the finish time rose considerably from 2018 to 2019, settling at a value of 0.66 hours in 2020. Noatum Container Terminal underwent a heavier fluctuation. In 2019 it experienced a sudden growth in the number of calls and movements, but the terminal could handle the finish time, setting it in 0.98 hours. This led to a higher-ranking position, from 9th in 2018 to 7th in 2019. However, by 2020, activity decreased while the finish time remained stable, with a value of 0.92 hours, resulting in the 8th rank by 2020.
5.2 Malmquist Index
The MPI was applied to analyze the temporary changes in productivity of the 17 container terminals from 2018 to 2020. The MPI is divided into the TECI and the shift in production frontier related to the TCI. The index attributes the origin of the changes to productivity or technological reasons. These indicators are displayed in Table 6,
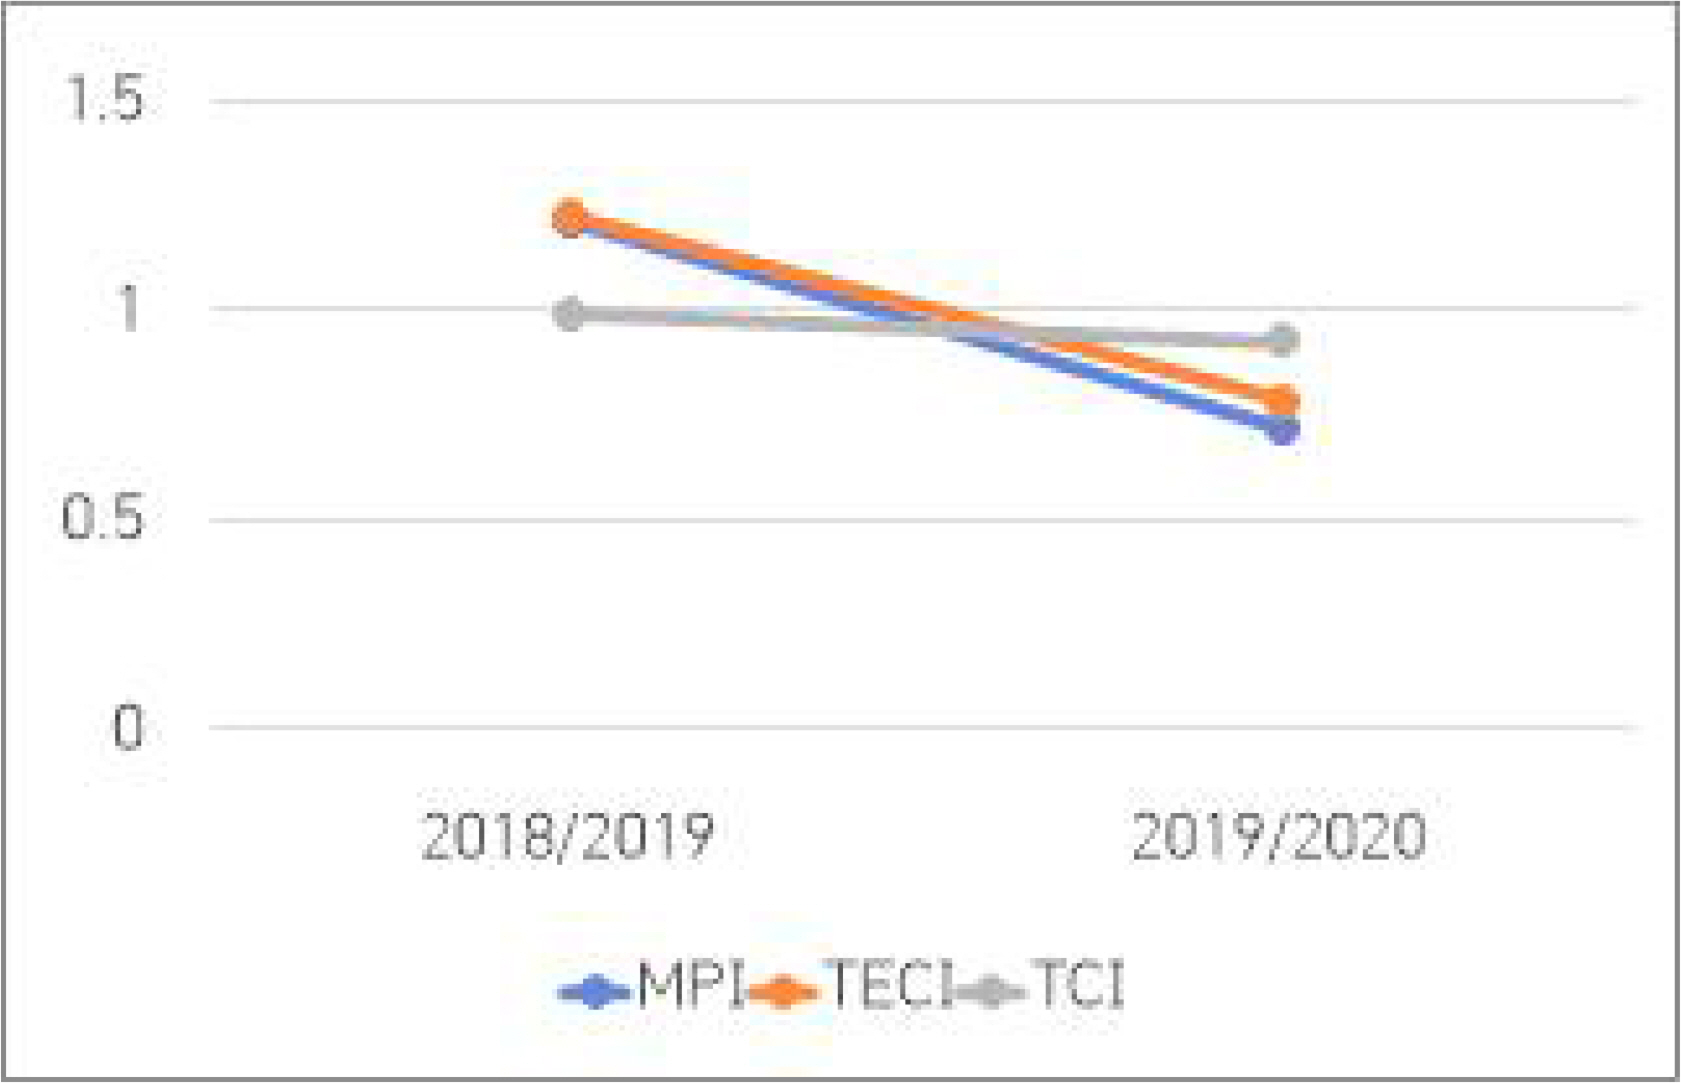
Table 7 and Figure 4 show a comparison of the average MPI, TECI, and TCI values for the years 2018/2019 and 2019/2020. As observed in Figure 4, the three indexes present a decreasing pattern, specially acute for TECI and TCI values, which indicates an overall drop in the productivity of the container terminals over the studied period. It can be observed in Table 6 that only DMU 3 and DMU 7 experienced a slight increase in the MPI due to a rise in the TECI. Attending to the values presented in Table 7, the period of 2018/2019 reveals that changes in TECI significantly affected Spanish container terminals in comparison to changes the steady values of TCI for both periods, which improved the MPI to a 1.216. However, for 2019/2020 the TECI value faces a regression of a 35,76% compared to the previous years, with an MPI below 0, indicating a reduction in productivity. Therefore it can be interpreted that the analyzed input and output variables were no longer efficient for the 2019/2020 period as it was for 2019/2020.
6. Conclusion
This study is conducted to obtain the efficiency of 17 Spanish container terminals. Three kinds of DEA methods were applied, as summarized below.
First, DEA-CCR is used for evaluating basic efficiency. The most efficient terminals are DMU 1, DMU 2, and DMU 5. There are some causes for these findings. In case of the attractive terminals in Spanish ports, they have appropriate facilities to be capable of handling container volume. And it makes to become a factor in attracting throughput. Also new port facilities assists port activation. For example, the BEST is a multimodal semi-automated terminal. The APM Terminal Algeciras and BEST steadily invest in new facilities. In the absence of logistics or infrastructure, a container yard that is too large induces inefficiency. On this aspect, developing and utilizing port hinterland is essential. Inefficient terminals do not attract infrastructure. Therefore, appropriate development should be made through demand forecasting.
Second, undesirable DEA suggests inefficiency from the undesirable output. This study considered the finish factor an undesirable output, contributing to inefficiency. Overall, the efficiency scores are reduced. DMU 1, DMU 2, and DMU 5 maintain efficiency regardless of the finish factor, demonstrating that inefficient terminals should control finish more than efficient terminals. The terminals affected by the finish factor include Terminals Maritimas del Sureste, Santa Lucia (Cartagena Basin), and Cadiz City Basin. These terminals are in the middle range among Spanish terminals and should increase their quality of finish. Also, the finish factor is related to the optimization of terminal operation. Therefore, rather than the unconditional building of equipment, the proper distribution of vessels and the port entry plan must be inspected.
Third, MPI was implemented to dynamically observe technology and efficiency changes attending to the product of TECI and TCI values. In the present study TECI changes were found to hold a greater impact on the MPI. Herein, It can be presumed that Spanish container terminals underwent a change in efficiency attributable the influence of external factor such as negative fluctuations in port calls and moves. As the inputs remain stagnant throughout the studied period it can be inferred that a systematical development of the infrastructure can reduce the Finish Time (O1), therefore improving the efficiency of Spanish container terminals.
Many studies have been conducted to evaluate Spanish port efficiency. However, this study focused on three methods. Although it is difficult to determine every variable that can potentially affect the efficiency of Spanish container ports, this study promotes a broader understanding of the Spanish container terminals by implementing the above-mentioned methodologies. The efficiency of the terminal can be expected to increase through using the methods presented in this study.


 PDF Links
 PubReader
 ePub Link
 Full text via DOI
 Download Citation
 Print
Print


