Experimental Investigation of the Hydrodynamic Characteristics of a Ship due to Bank Effect
Article information
Abstract
When a ship moves in the proximity of the lateral bank, bank suction forces are generated due to bank effects. Thus, hydrodynamic forces can significantly impact the ship’s maneuverability and navigation safety. In this study, model tests were performed to investigate the hydrodynamic forces exerted on a ship, especially suction forces caused by bank effects, using captive model and bank effect tests. A low-speed condition was selected in this study, because of the perilous situation as the ship moves close to the bank. The accuracy of the hydrodynamic forces exerted on the hull was verified, by comparing the results of the static drift test with the results obtained from other institutes at design speed. The straight simulation caused by bank effects was then implemented using estimated hydrodynamic coefficients.
1. Introduction
Nowadays, waterway transport is growing, so the demand for transportation of ships to harbors, canals, rivers, and restricted water areas is increasing. One of the parameters in restricted water is the influence of the lateral bank which significantly affects ship maneuvering. As the ship approaches the lateral bank, displaced water gets squeezed in between the ship’s hull and the lateral bank, since it has nowhere to go. Increase in the water flow causes a drop in pressure, pulling the hull down to fill the vacuum, thereby increasing the hydrodynamic force. Therefore, it is crucial to estimate the hydrodynamic force acting on a ship which is close to the lateral bank.
In the past, several researchers investigated ship maneuvering due to bank effects by means of numerical, experimental techniques. Vantorre et al. (2003) developed an empirical formula for predicting ship-bank interaction force by performing several model ships based on various water depths, lateral distances, forward speeds, and propeller rpm. Sano et al. (2014) and Liu et al. (2018) presented a mathematical model of hull hydrodynamic forces. The hydrodynamic force characteristics in shallow water and bank effects were investigated by conducting an experimental study using the captive model test. Besides, Sano et al. (2014) reported the directional stability in the channel based on the eigenvalue analysis and dynamic maneuvering motion simulation. Moreover, Lataire et al. (2008) evaluated the bank effects induced by irregular bank geometries and formulated a mathematical model. Hoydonck et al. (2019) reported a viscous-flow solver on two different CFD codes to predict the hydrodynamic force on the ship by applying a numerical method to the bank effects. The comparison of CFD results with those of experimental results illustrated the reliable prediction of the ship-bank interaction.
In this study, a model test was performed to investigate the hydrodynamic characteristics acting on a ship, considering the bank effects using the captive model and bank effect tests in deep water. Low speed was selected in this study due to risk conditions. In fact, the ship moved slowly to ensure safe navigation. The accuracy of the experimental results was proved by comparing the hydrodynamic force in the static drift test with other institutes at design speed. On the other hand, the mathematical models of twin-rudders and twin-propellers were presented for this ship. The ship maneuvering characteristics close to the lateral bank were evaluated by straight simulation using estimated hydrodynamic coefficients.
2. Mathematical model
2.1 Objective
A scale ratio of 1/11 was used as the target model ship for the captive model and bank effect tests. In fact, this ship was equipped with twin-propellers and twin-rudders. However, within the scope of this study, only the bare hull was used for the experiment. Besides, the mathematical models of twin-propellers and twin-rudders were introduced and applied for maneuvering simulation. The model ship is depicted in Fig. 1, the parameters of the ship are described in Table 1.

Model ship

Parameters of ship
2.2 Equation of motion
2.2.1 Coordinate system
Fig. 2 describes the two right-hand coordinate systems in the ship. The earth-fixed coordinate system O−xy defines the ship trajectory, and the body-fixed coordinate system o−xbyb defines the hydrodynamic force acting on the hull. Three Degrees of Freedom (3-DoF) equation of motion was applied in this study, based on Newton’s second law of motion. Additionally, the MMG (Maneuvering Modeling Group) model introduced by Yasukawa et al (2015) was employed for maneuvering simulation of the ship. Thus, the equation of motion under the coordinate system was expressed as in Eq. (1).
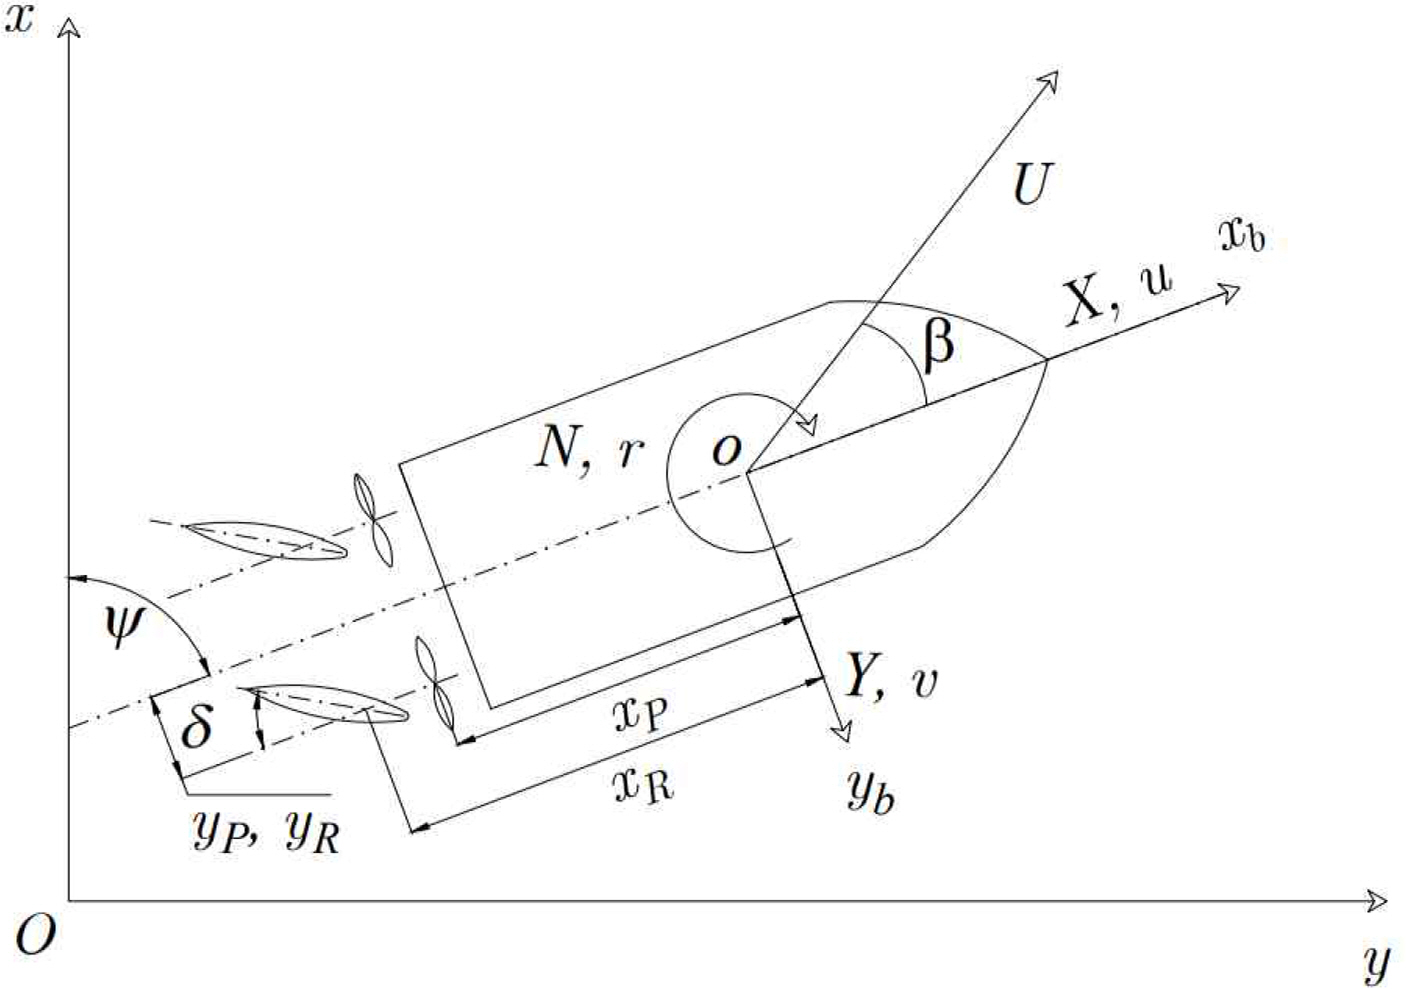
Coordinate system
2.2.2 Hull hydrodynamic forces
The hydrodynamic force acting on the ship hull considering bank effect was investigated in this study. Static drift circular motion and combined circular motion with drift test were performed to estimate the linear and non-linear hydrodynamic forces with respect to surge velocity (u), sway velocity (v), and yaw rate (r), respectively. For bank effect, the hydrodynamic forces were expressed in terms of lateral distance from bank to the center of the ship (yBank) as shown in Fig. 3. Vantorre et al. (2003) proposed the variable ηb = 1/yBank for bank effect, which easily described the hydrodynamic force as a third-order function. Sano et al. (2014) and Liu et al. (2018) reported mathematical models of the hydrodynamic forces acting on the hull considering the bank effects.

Vertical bank configuration
Non-dimensional of the hydrodynamic forces and variables were expressed in Eq. (3), where ρ is water density.
2.2.3 Propeller model
This ship was equipped with twin-propellers and twin-rudders. Kim, et al.(2021) proposed a mathematical model of twin-propellers and twin-rudder for Korea Autonomous Surface Ship (KASS). The propeller model is presents as follow,
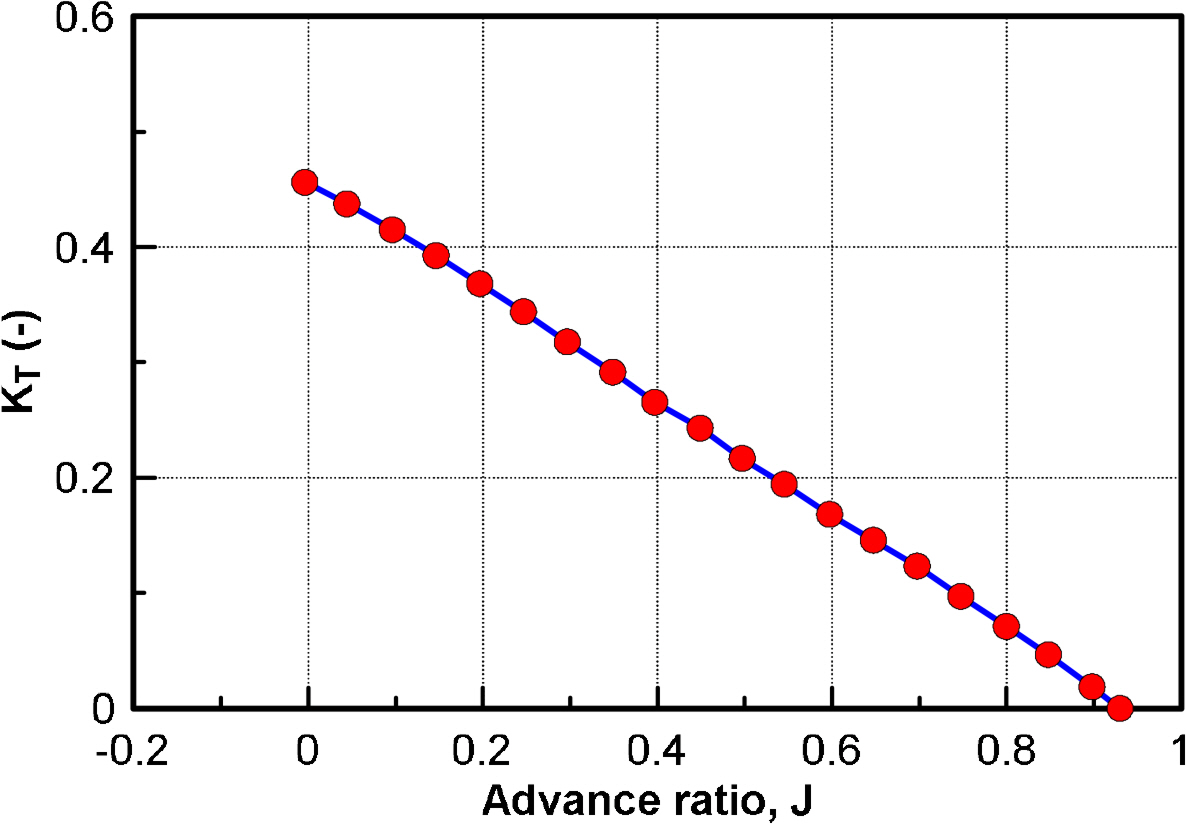
Thrust coefficient of POW test (KRISO)
2.2.4 Rudder model
Effective rudder forces for twin-rudders were expressed as follows:
The parameters were defined as follows:
3. Model test
3.1 Experimental setup
The experiment was performed in the model basin in Changwon National University, Korea. The dimension of the model basin is 20.0 m in length, 14.0 m in breadth, and 1.95 m in depth. The ship was installed in the carriage where the ship was towed together with the support structure. The load-cell with two components for the force in the x-direction and y-direction was utilized to measure the hydrodynamic force acting on the ship hull. Two load-cells were located near the bow (point A) and stern (point B) as shown in Fig. 5. All motions were restrained throughout the experimental process.
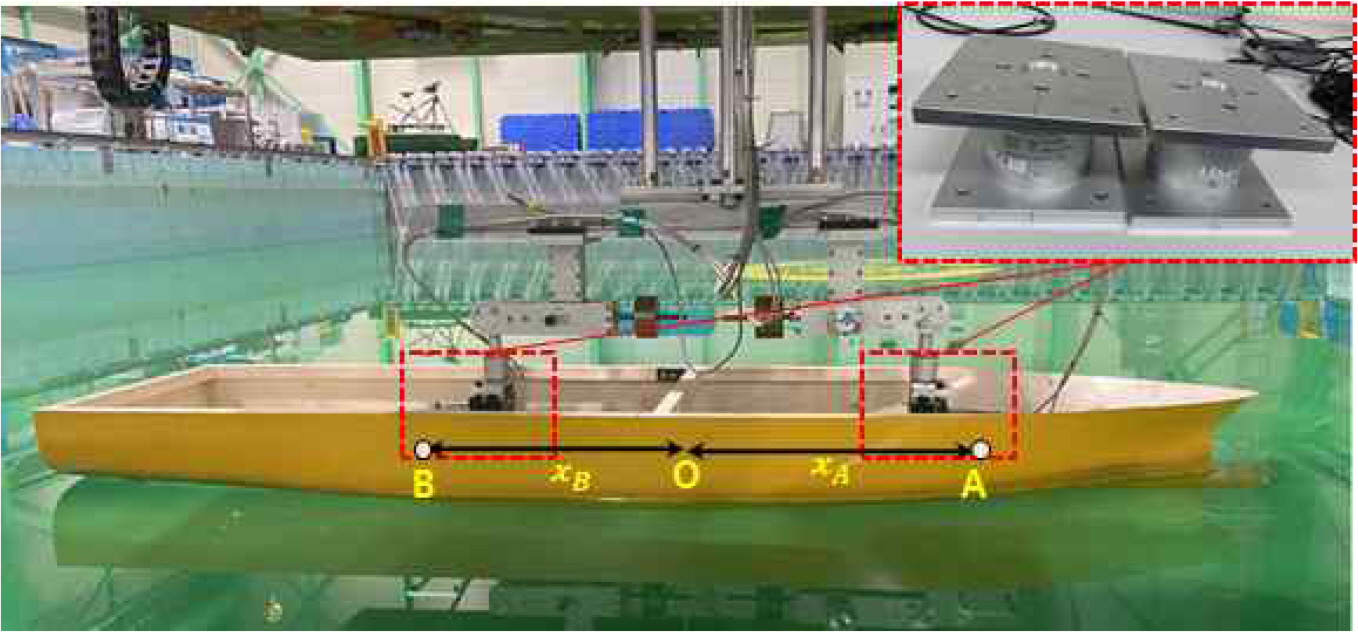
Experiment installation
Because the sidewall of the tank was far from the limitation of the carriage movement, the lateral bank, which was a straight line, was manufactured using wood plates which were fixed by wires and clamps to ensure sufficient strength (Fig. 6). The standard deviation of the lateral bank was 3 mm. Fig. 7 shows the experimental setup of the ship close to the bank in deep water.
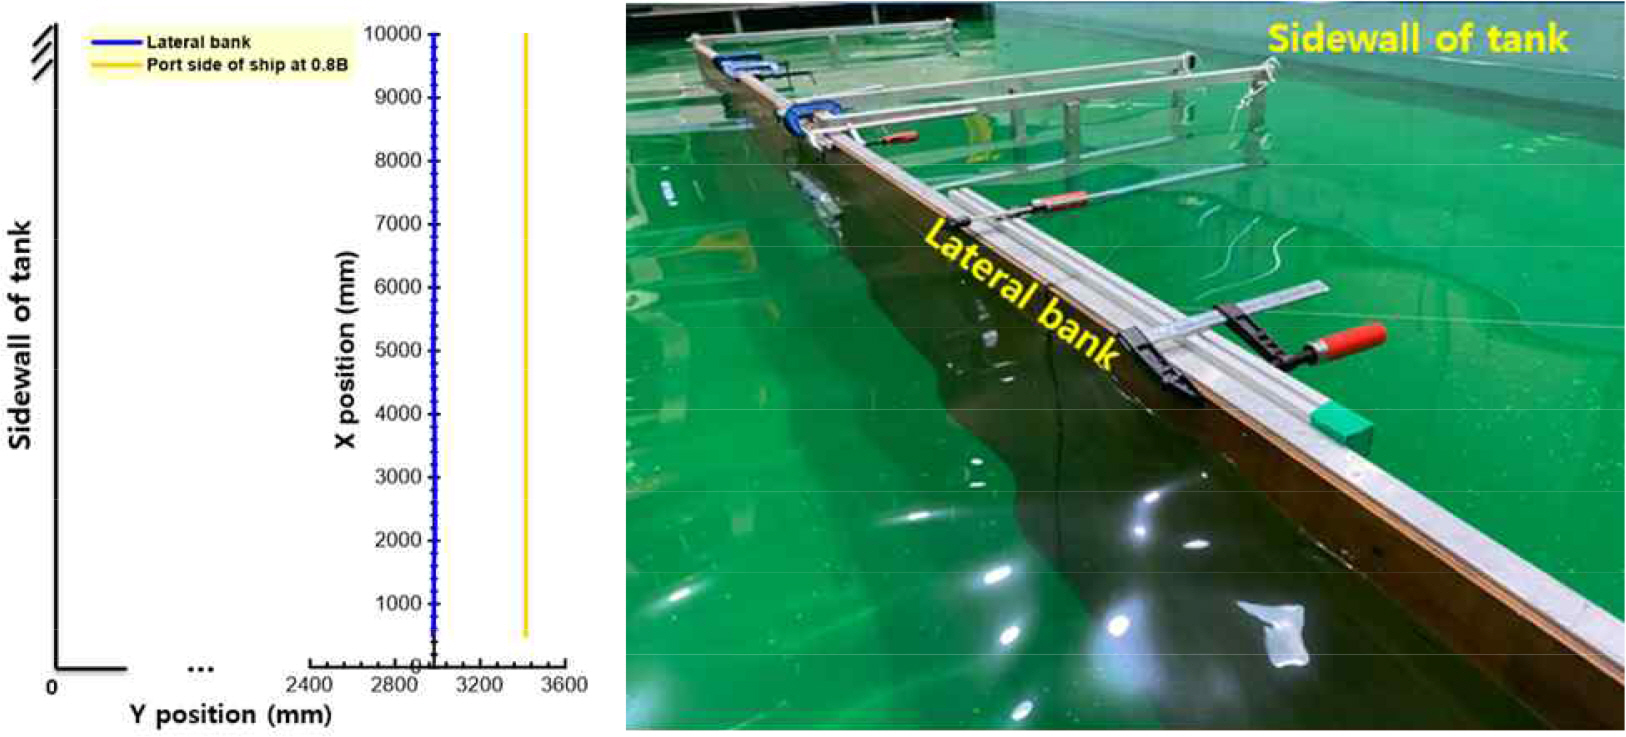
Lateral bank installation

Ship close to the bank
3.2 Test condition
As mentioned in the mathematical model of the hull, the hydrodynamic force was obtained from the captive model test and bank effect in deep water. On the other hand, because of the influence of the bank effect, the ship was moved at low speed to ensure safe navigation. Therefore, the captive model test and bank effect were carried out at low speed. Besides, the static drift test was conducted at design speed to allow comparison with other results and thus ensure the experiment’s accuracy. Table 2 describes the test conditions in this study.
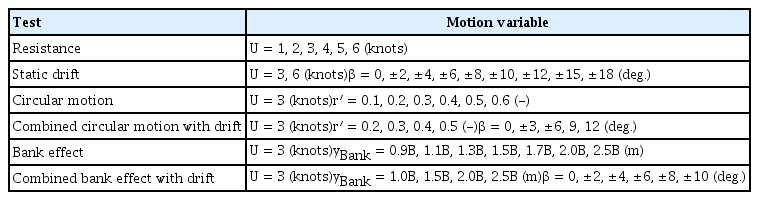
Test condition
3.3 Experimental results
The hydrodynamic forces acting on the ship are the main concerns for evaluating hydrodynamic coefficients. Fig. 8 shows results of resistance test for various speed. It is the drag acting in the x direction when the ship goes straight and it was performed to obtain the hydrodynamic coefficient with respect to surge velocity as Xuu. Fig. 9 displays results of static drift test for various drift angle to achieve the hydrodynamic force with respect to different sway velocities, namely, Xvv, Yv, Yv|v|, Nv, and Nv|v|. The sway velocity is the function of the drift angle (β) defined as v =−U sinβ. In addition, the measured results of hydrodynamic forces of static drift test were compared with those performed by Kim et al.(2021) at design speed. A good agreement, which verified the quality of present experiment method, was observed in yaw moment and linear term of sway force. However, the non-linear term of sway force was slightly different, Kim et al.(2021) results were greater than the present results, it may be the difference in the experimental setup, ship’s scale ratio, and appendages attached on the ship. The present experiment fixed the roll and pitch motions throughout the performance. Moreover, the twin-propeller and twin-rudder were included in the Kim et al. (2021) model, this could also account for the different results.
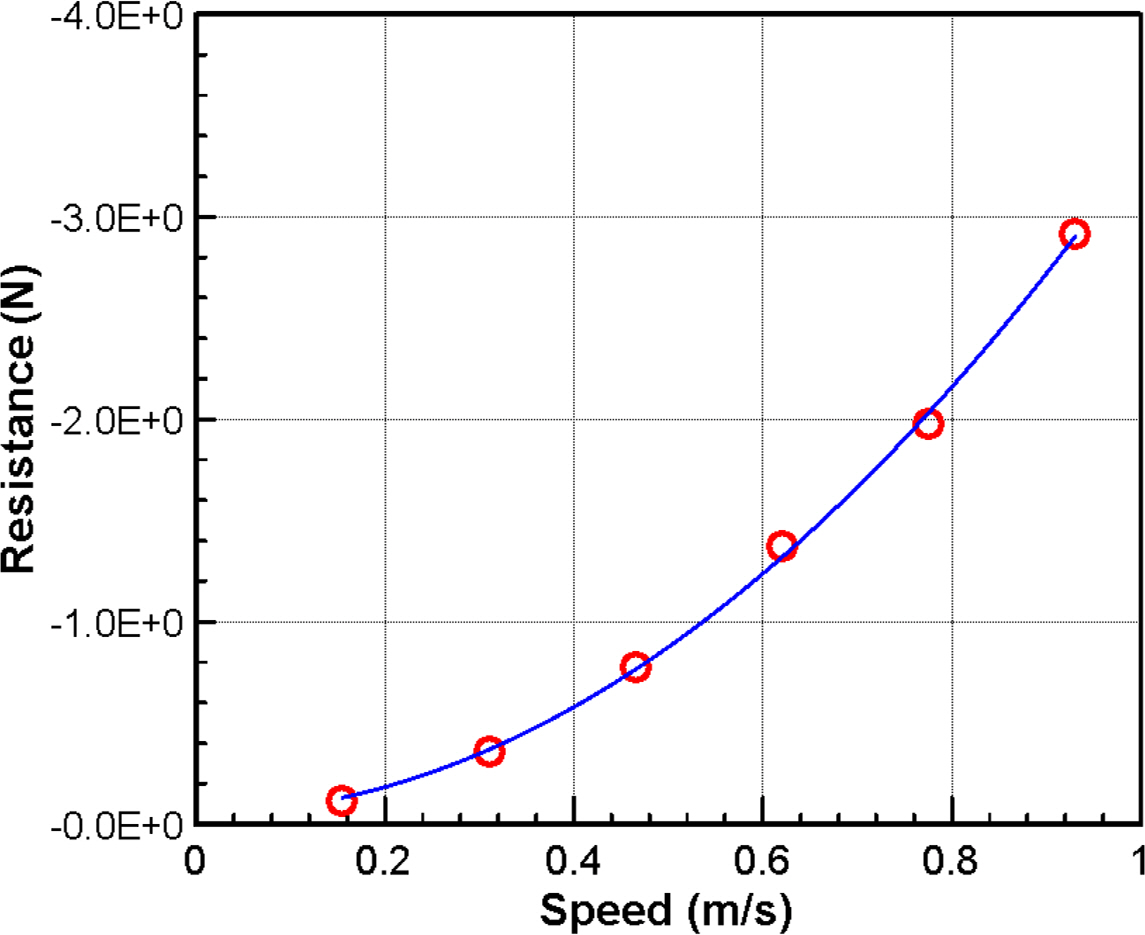
Results of resistance test
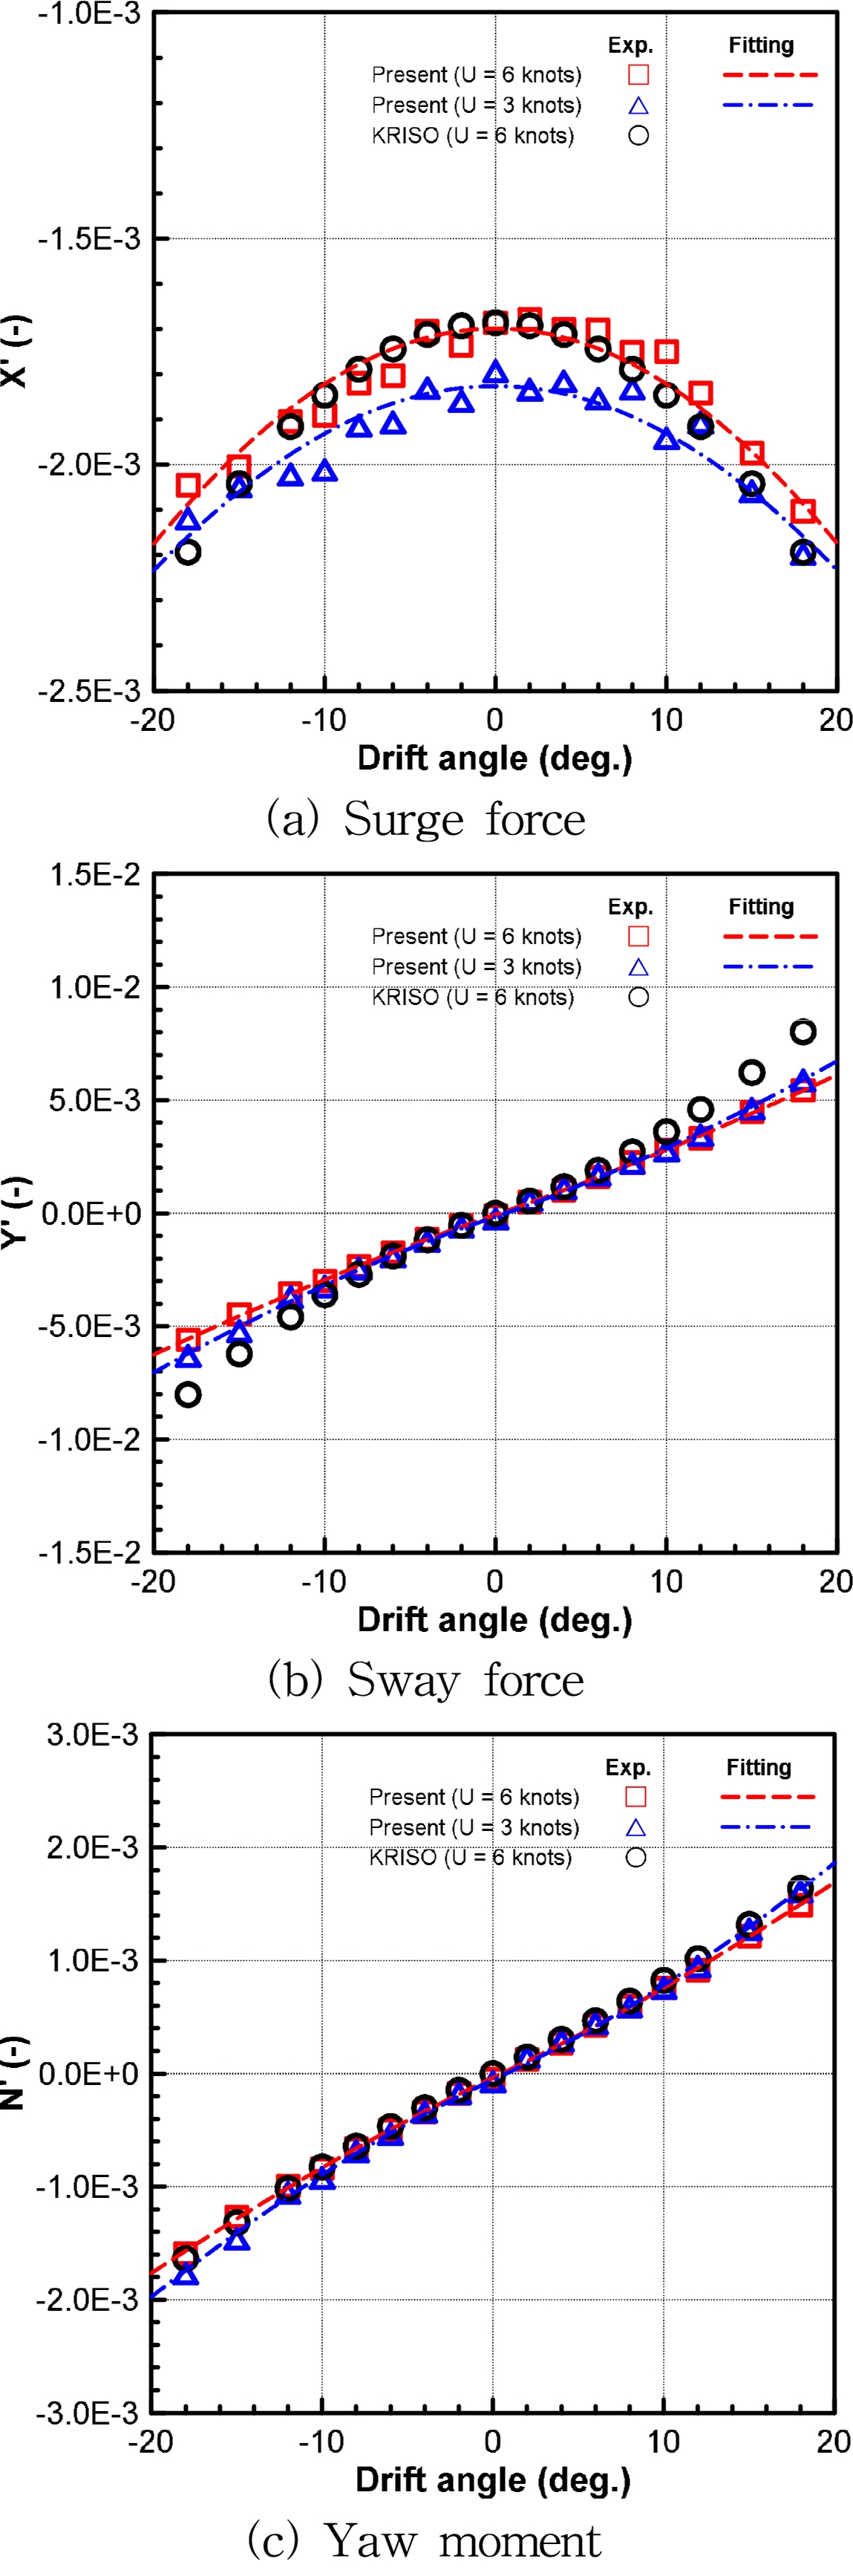
Results of static drift test
Fig. 10 shows the results of circular motion test conducted at various angular velocities. This test was carried out to obtained the hydrodynamic forces with respect to different angular velocities, such as, Xrr, Yr, Yr|r|, Nr, and Nr|r|. Combined circular motion with drift test is shown in Fig. 11. Coupled hydrodynamic forces relative to sway velocity and angular velocity as Xvr, Yvvr, Yvrr, Nvvr, and Nvrr were considered by subtracting the hydrodynamic forces with respect to sway velocity in static drift test and angular velocity in circular motion test. A good fit was observed for all the tests.

Results of circular motion test

Results of combined circular motion with dirft test
On the other hand, the ship-bank interaction was conducted at various lateral distances. Figs. 12 and 13 show the suction force of the bank effect test and combined bank effect with drift, respectively. As explained above, when the water has nowhere to go, it gets squeezed in the space between ship and lateral bank, causing an increase in the velocity between ship and bank, creating a larger hydrodynamic force as the ship moves closer to the lateral bank. To easily obtain the third-order function of hydrodynamic force with respect to lateral distance to bank, the non-dimensional distance (ηb′) was calculated by dividing half of the ship’s breadth by the lateral distance.
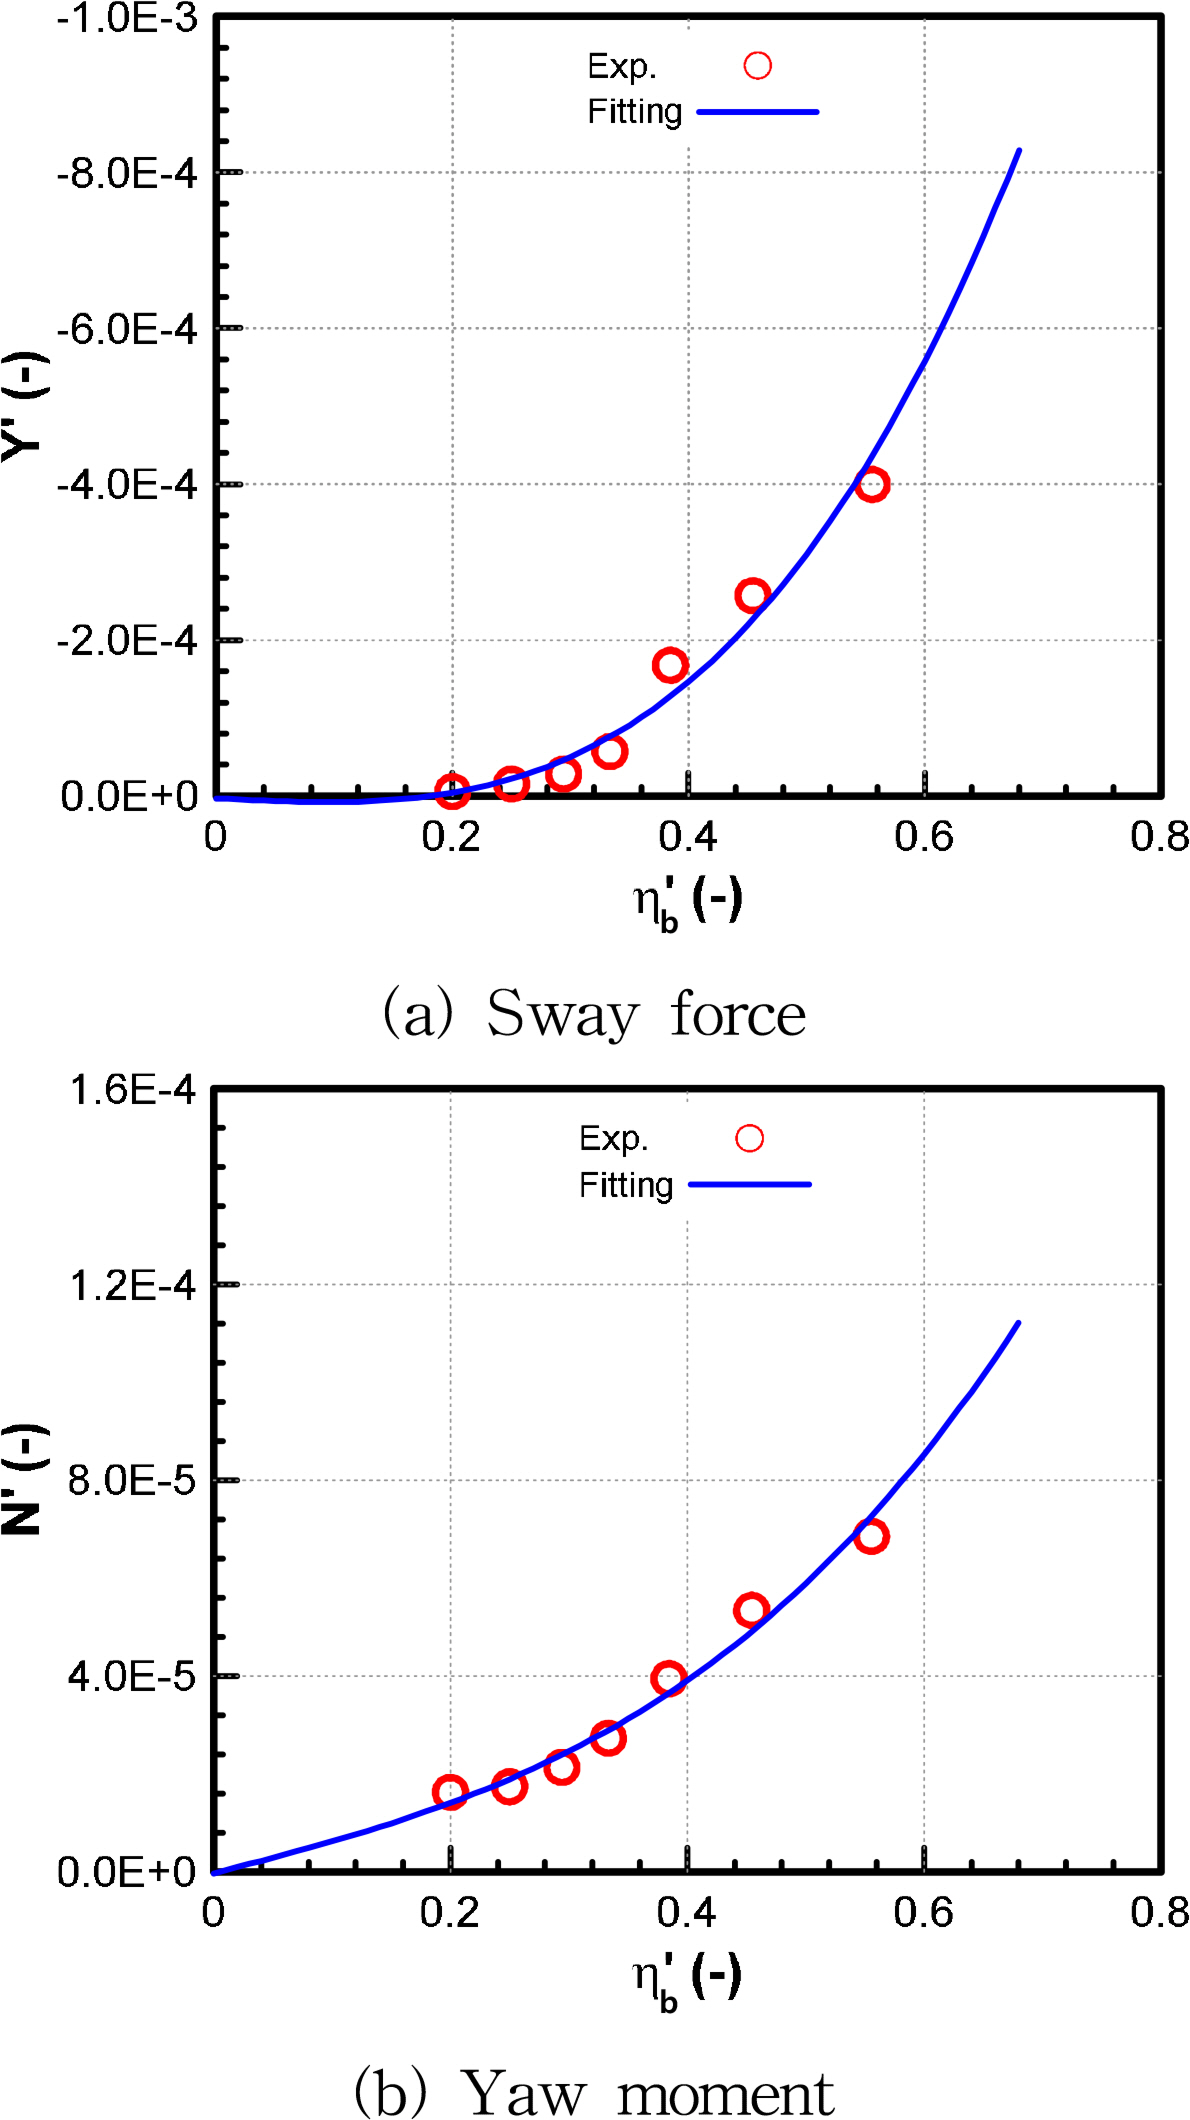
Results of bank effect test

Results of combined bank effect with drift test
4. Maneuvering simulation
The hydrodynamic coefficients were estimated by fitting the hydrodynamic force using the least squares method. Table 3 presents the hydrodynamic coefficients used for maneuvering simulation in which damping hydrodynamic coefficients obtained from the present experiments, added mass coefficients as Xu̇, Yv̇, Yṙ, Nv̇, and Nṙ obtained from pure sway test and pure yaw test by Kim, et al(2021), and interaction coefficients as (1 − tR), (1 + aH), ε, κ, γR, CP obtained from the static rudder, combined static rudder with drift test by Kim, et al.(2021).
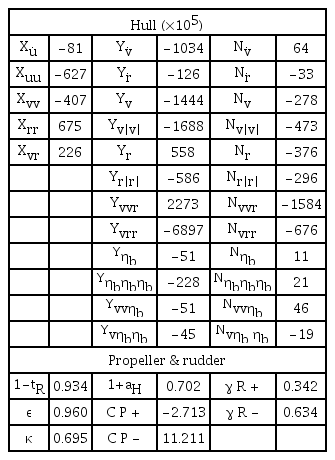
Hydrodynamic coefficient
In order to validate the hydrodynamic coefficients obtained by the experiments, the maneuvering simulation was carried out and compared with the simulation results by Kim et al. (2021). The turning and zig-zag maneuvers did not include the terms of hydrodynamic coefficients generated by the bank effects. Fig. 14 shows the comparison of the trajectory, ratio of resultant speed to approach ship speed, and yaw rate in turning maneuver. Fig 15 shows the comparison of the trajectory, heading angle, rudder deflection angle, and yaw rate in zig-zag 10°/10° maneuver. The present simulation results give a good agreement with the results obtained by Kim et al. (2021). It confirmed the present hydrodynamic coefficients were reasonable to evaluate the ship’s maneuverability.

Comparison of 35° starboard turning
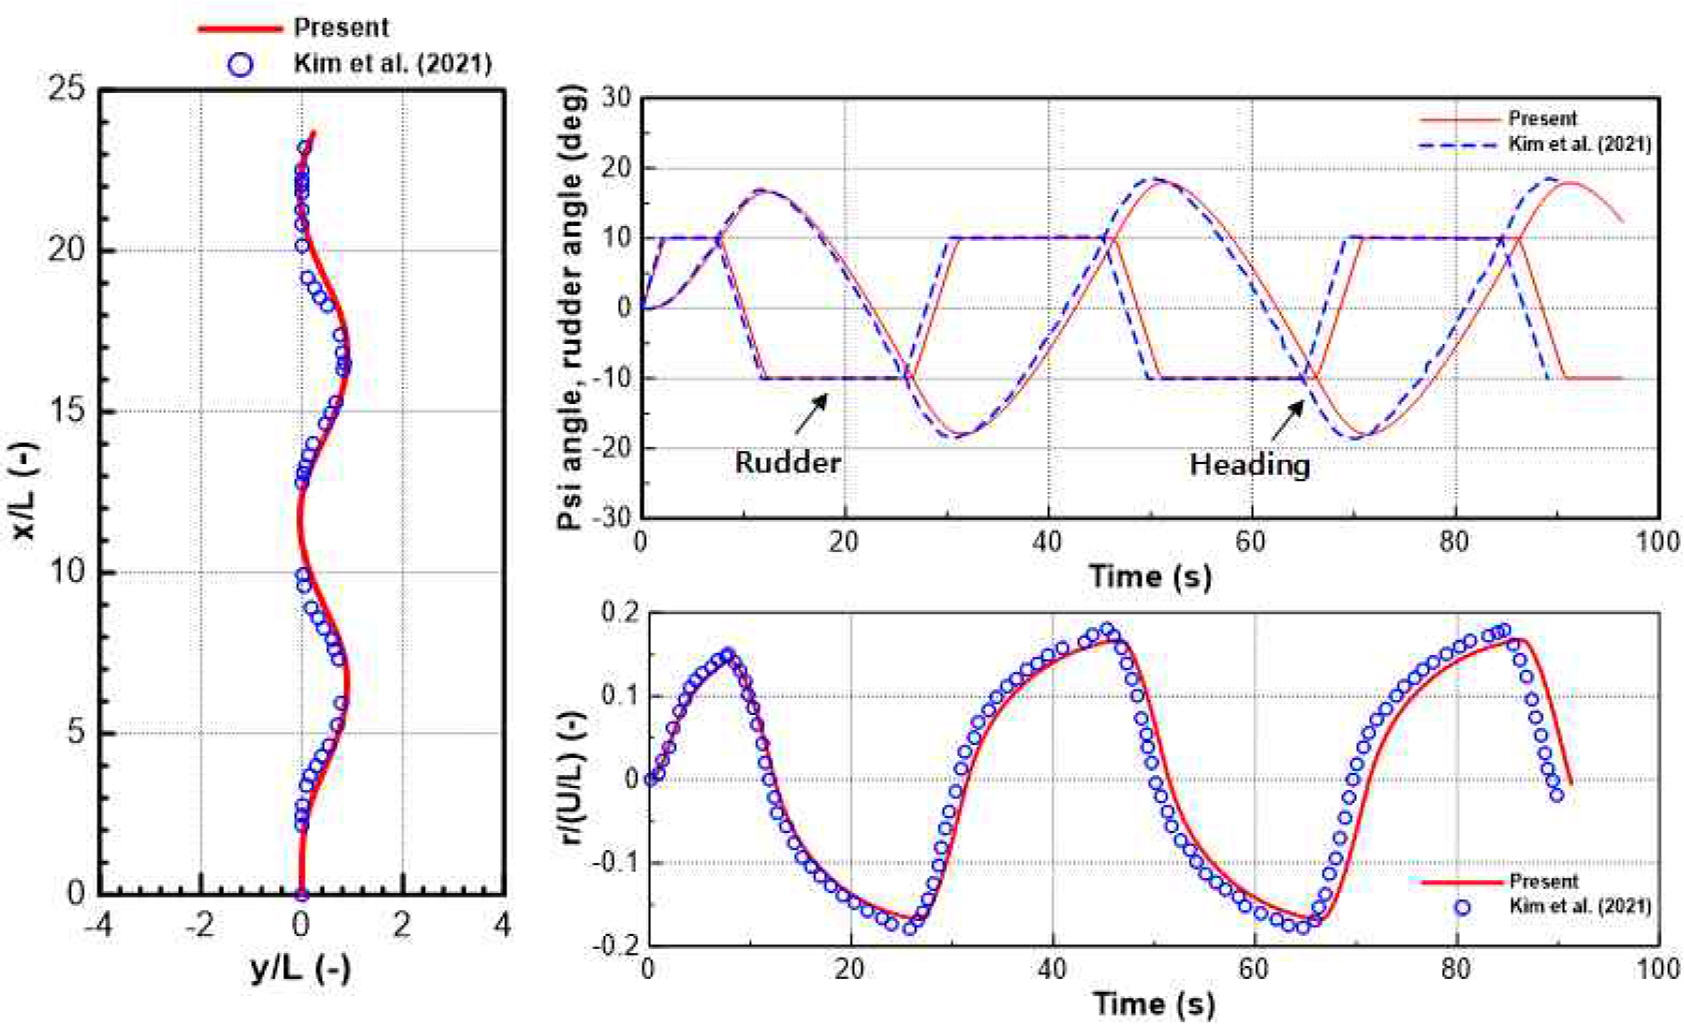
Comparison of 10–10 zigzag maneuver
Fig. 16 shows a straight simulation when the ship moved in a straight direction close to the lateral bank by applying estimated hydrodynamic coefficients to the equation of motion. As shown in the figure, the ship did not move in a straight direction and tended to move far away from the bank. This was caused by a suction force when the velocity increases at the space between bank and ship which leads to a difference in the pressure on the each of the ship sides. Moreover, the increased pressure around the ship’s bow created a yaw moment pushed the ship away from the bank.

Straight running simulation nearby bank
Additionally, the turning rate was reduced as the ship moved far from the bank and the ship could keep a straight path at a lateral distance far enough from the lateral bank. This is demonstrated in Figs. 17–18 which presents the yaw rate and heading angle throughout the straight simulation, it is easy to understand when hydrodynamic force becomes negligible as the ship is far from the bank enough. As the ship is quite close to the bank (yBank = 1.0B), the yaw rate increases dramatically and rapidly, of course, it also quickly decreases even smaller than other cases at x/L=12 where the ship reaches a large enough distance to be unaffected by the lateral bank. Because the ship position of yBank = 1.0B reaches y/L=1.5 at x/L = 12, while the ship position of yBank = 1.5B is being y/L=1.0. The yaw rate at yBank = 1.5B and yBank = 2.0B also smaller than yaw rate at yBank = 2.5B at a position, however, this process is slower, it can occur at x/L=15 even father.

Yaw rate at several Bank distances

Heading angle at several Bank distances
5. Conclusion
In this paper, an experimental study was performed to investigate the hydrodynamic characteristics with respect to the bank effect. The hull mathematical model considering the bank effect was presented. Moreover, the mathematical models of twin-rudders and twin-propellers were given for this ship. The captive model and bank effect tests were implemented to obtain the hydrodynamic force with respect to variables relative to 3-DoF motion. The accuracy of the experiment method was verified by comparing the results of the static drift test with results from other institutes at design speed. A good agreement was observed without the non-linear term of sway force. On the other hand, the bank effect test illustrated that the hydrodynamic force of the ship increased as the ship moved close to the lateral bank, even though the ship moved in a straight direction. The hydrodynamic coefficients were obtained for 3-DoF motion by fitting the hydrodynamic force using the least square method. The straight simulation was presented when the ship moved close to the lateral bank by applying estimated hydrodynamic coefficients to the equation of motion. The ship did not move in a straight direction and tended to move far away from the bank as the ship moved close to the bank and kept a straight path at a lateral distance far enough from the lateral bank. The straight maneuver was performed to assess the influence of the lateral bank on maneuverability. Thereby, a control system by rudder deflection, as well as, the lateral distance will be calculated and reasonably designed in future work to keep straight maneuver when the ship moves close to the bank.
Acknowledgements
This research was supported by the ‘Development of Autonomous Ship Technology (PJT201313, Development of Autonomous Navigation System with Intelligent Route Planning Function)’ funded by the Ministry of Oceans and Fisheries (MOF, Korea).