A Data Mining Algorithm to Gaining Customer Loyalty to Ports Based on OD Data for Improving Port Competitiveness
Article information
Abstract
Every port is competing for attracting loyal customers from other ports to achieve more profits stably. This paper proposes a data-mining scheme to facilitate this process. For resolving the problem, the OD (Origination-Destination) data are gathered from the AIS (Automatic Identification System) data. The OD data are clustered according to the arrival dates and ports. The FP-growth algorithm is applied to mine the frequent patterns of ships arriving at ports. Maintaining a loyal customer list for port updates and accuracy is critical in establishing its usefulness. These lists are critical as they can be used to provide suggestions for new products and services to loyal customers. Finally, based on the frequent patterns of the ships and the mode of arrival times, a formula proposed in this paper to derive shipping companies’ loyalty to ports was applied. The case of Kaohsiung port was shown as an example of our algorithm, and the OD data of ships in 2017-2018 were processed. Using the results of our algorithm, other rival ports, such as Shanghai or Busan, may attract customers no longer loyal to Kaohsiung ports in the last two years and attract them as new loyal customers.
1. Introduction
(Tongzon, J. et al. 2005) indicates that globalization of industry is fast breaking down the traditional practice whereby shipping companies favored certain ports. Increasingly, carriers and shippers are showing less loyalty to specific ports. Ports face the constant risk of losing important clients. (Caliskan, A. et al. 2020) notes that loyalty is the most valued asset for companies to survive in a highly competitive arena. A key aspect for adoption of digital technologies is strategic planning to improve port customer loyalty.
As the port market becomes more matured and saturated, ports are fiercely competing to attract new customers. It is very important for ports to grasp existing customers and also further develop their value-added services to improve their competitiveness. It is one of the most important factors of the port profit to keep customers and increase the loyalty of shipping companies to port. It is necessary for ports to identify the loyal customer groups and enhance customer loyalty to keep their customers. For this purpose, the way how to quantify customer loyalty of ports is a key question to be resolved.
Previous scholars have studied key factors of customer loyalty when shipping companies choose ports. Even though key factors of the loyalty are found, ports might have difficulty to specifically know who their loyal customers are.
(Foster,T. 1978) has found that transport costs and port rates can be considered as the most important key factors for influencing the loyalty of customers.
The research of (Slack, B. 1985) has confirmed Foster’s results. (Hosmer, B.E. 1998) proposes that the fundamental driving force of customer loyalty is port service quality. (Hosmer, B.E. 1995) considers that all execution of market research and marketing constitute the marketing work of port enterprises. Market research activities mainly include analyzing the market of port enterprises, setting up corporate goals, formulating marketing strategies, and identifying marketing targets. (Laxe, F.G. 2010) considers that the port market has a lot of competitive market demands. The port market is considered as a high-value tool to search and capture new markets and products. Loyal customer is thought as the core factor to improve the port competitiveness.
However, the previous methods are difficult to quantify the loyalty of customers based on the key factors. Hence, another nice scheme is needed to get customer loyalty easily. We introduce a frequent pattern of ships as a set of ships that are frequently arriving at a certain port during a certain period. Our goal is to derive loyal customers from the frequent patterns of ships.
The International Maritime Organization (IMO) number is a uniquely assigned number to each ship for identifying ships in case of disaster. The IMO number gives the information about the ship and its shipping company. Thus, if we mine the frequent patterns of ships, we can easily identify the shipping companies whose ships frequently enter a certain port. In other words, loyal customers to ports can be mined easily based on the frequent patterns of ships. The ranks of loyalty of customers for each port can also be evaluated. Then, ports can setup precisely their own strategies using the rank information to attract new loyal customers and improve their competitiveness.
The main contributions of this work are as follows: Firstly, we derive a computational method with the FP-growth algorithm that can get directly and accurately customer loyalty of shipping companies. This is the first attempt to get customer loyalty of shipping companies based on the frequent patterns of ships. Secondly, using real OD data actually gathered from some ports in China, it is shown that our proposed scheme achieves some clear results effectively.
This paper is organized as follows: Section 2 reviews the previous works. Section 3 describes our scheme. Section 4 shows the results of experiments. We discuss several issues regarding the results in section 5. Finally, section 6 gives the conclusion and possible future works.
2. Previous Works
Domain experts were required to subjectively make a set of customer loyalty factors, from which each current loyalty was compared with that of the last years. This was aggravated by the fact that factors tend to change over time in the real world due to concept drift.
(Ng, K. et al.1998) noted that a prototype OLAP (Online Analytical Processing)-based system has helped PSA (Port of Singapore Authority) to identify the influencing factors for customer loyalty and to monitor for customer segments. However, the influencing factors were changed quickly because of concept drift. The customer loyalty should be calculated by one factor. (Chang, C.H. et al. 2016) used Kaohsiung Port as a case study to evaluate the relationships among port security quality, port service quality, customer satisfaction, and customer loyalty.
(Rishika, R. et al.2013) chose to work with visiting frequency of customers as the focal variable because it captured the intensity of relationship between firm and focal customers and services as a key driver of customer lifetime value. As a result, arrival times (visiting frequency) was an important variable that directed to customer loyalty. (Huang, M. H. et al.2016) showed that loyalty of customers with higher visiting frequency would be stronger.
Therefore, port customer loyalty can be defined as the willing of ship companies to buy port product or service at present and also in the future despite situational influences and marketing efforts having the potential to cause commercial behavior. What visiting a port means nothing but buying the services provided by the port. Hence, a ship with higher arrival times for a port can be considered as a loyal customer to the port.
(Laxe, F.G. 2010) considered that the government wanted to make very attractive ports and occupy the market. The government needed to collect elements that might affect to the marketing. Loyal customer was one of the most important factors to set up the marketing strategy. Needs of customers were considered as the most important thing to make the port competitiveness stronger. Ports should improve their quality of services and make better products for attracting loyal customers.
Fernando grouped the clients based on their needs from which the port could determine the behavior of goods, services, and products. Several types of customer data were used and analyzed. The process needed long time to find loyal customers and the global attractiveness was also difficult to be derived from the data. Fernando’s port marketing strategy could not be run on the computer for calculating customer loyalty of ports.
(Han et al. 2000) proposed a FP-growth algorithm. FP-growth algorithm only scanned the database twice to reduce the search cost, which is adopted to mine the frequent patterns of ships in this paper. All combinations of IMO number could be considered as frequent patterns because the arriving order and time of ships at certain ports might be appeared as combined in various ways. Among them, only a few combinations of ships were interested to identify a loyal customer.
(Huang, L.J.2007) applied FP-growth algorithm to design individualized virtual shop on the Internet. The individualized virtual shop could not only help to realize one-to-one marketing strategy, and increase purchasing interest and loyalty of the consumer to virtual shop, but also made virtual shop gains more profit and more competitiveness. (Wang, S. C. et al.2019) found out the more valuable customers in each cluster to solve the problem that the RFM (Recency, Frequency, Monetary) total score had a large difference in different product attributes. After identifying the customers who were more valuable to the company, they then observed the products they purchased based on their past transaction data and performed the FP-growth algorithm.
Spatial flow data, also known as origin-destination (OD) data, has been widely researched in urban planning, economics, tourism and many other fields (Manley, E. et al. 2019). (Alsger, A. et al. 2018) used OD surveys to calibrate a rule-based model that estimates the purpose of smart card trips in Brisbane. OD data made us to mine the underlying relationship between ports and ship companies. The complex data and factors made it difficult to be learned. Therefore, the OD data was the key element applied in customer (ship company) behavior analysis.
Our research shows an empirical result on the relationship between ship companies and ports. The previous studies measured multiple factors of port customer loyalty. In our study, however, the number of arrivals (arrival times) of ships is considered as a unique factor to derive port customer loyalty. Main contribution of our work is a novel scheme of measuring the port customer loyalty in a different context compared with the previous studies. The new scheme is a specific procedure to get the port customer loyalty from the arrival times of ships.
3. A Data Mining Algorithm to Get the Customers Loyalty to Ports
Nowadays, AIS (Automatic Identification Systems) are installed on cargo ships. Researchers can collect easily the location data of ships during a period of time from the AIS data. The departure and arrival ports of ships can be found from the location data of the AIS data with time stamps and identifiers of ships. We can also extract original ports and destination ports of ships and times from AIS data. That is the OD data that we are dealing with. It has three-tuple data of time, originality and destination ports.
Although there are many ways to get ranks to show the competitiveness of ports, we use the ranking of the number of arrivals that can reveal various information. The loyal customer is one of the most important factors of making different rankings. A nice method should be provided to get customer loyalty from the rankings of ports.
OD data are essential to ships because it can show the movements of demand. It may also allow to understand ships travel behavior better. The data can be used to characterize the customer loyalty. It is important to know OD data for ports development initiatives. Ports can demonstrate the prospective carriers the service value of ports using OD data. Ports can use OD data as important input to setup market share models to predict the profitability. Port authorities (PA) can also use the information to measure the impact of service quality. PA can provide support for joint promotional initiatives with other port products or services and set focus on their marketing to the most important customers.
We understand that customers visiting more frequently are the primary driver for sales. We also understand that tracking of them gives a good idea of improving service quality. The number of arrivals (arrival times) can be calculated by OD data. The arrival times plays a significant moderating role on the relationship between ship companies and ports. When ships arrive repeatedly at a certain port, they are likely to use services provided by the port. These relationships now lead port authorities to get potential loyal customers. That is likely to motivate the patronage of the port facilities and readiness to pay more for the valued service. Therefore, the arrival times is a key factor applied in measuring the customer loyalty to ports.
Our algorithm is given in Fig.1. The algorithm starts with reading the OD data as step 1. The OD data usually are gathered at each port for a certain period like one year.
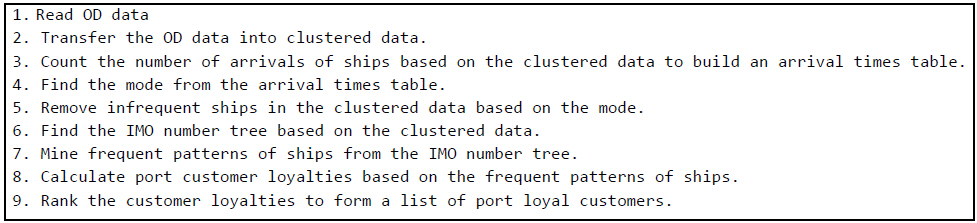
A data mining algorithm to get customer loyalty
In the second step, ships arriving at the same port on the same day are grouped into one group. It is called clustered data.
For recording the number of arrivals of ships, this algorithm makes a table in the third step. It is called arrival times table. The arrival times table has two-tuple data of key and value. The key is IMO number, and the value is the arrival times of the ship numbered by an IMO number. It is very easy to identify most frequently arriving ships by checking whose number of arrivals at a certain port. But this may not always derive reasonable results because it may have extreme values.
In the fourth step, this algorithm takes a mode for avoiding being affected by extreme values. The mode is defined as the value that appears most often in a set of arrival times of ships. Infrequently arriving ships can be identified by the mode. The infrequently arriving ships can be removed from the clustered data according to the mode in the fifth step.
IMO number tree is a collection of data. Every individual element in the tree is called a node. A node stores the IMO number and the arrival times of a ship and link to the next node in the tree. The IMO number tree is constructed using the FP-tree construction algorithm by (Han et al. 2000).
In the sixth step, to facilitate tree traversal, the clustered data was used to make nodes with the same IMO number be linked in sequence via such node-links. After scanning all the clustered data, the IMO number tree is founded.
The FP-growth algorithm is efficient and scalable for mining both long and short frequent patterns. Therefore, in the seventh step, the FP-growth algorithm is used to mine frequent patterns through the IMO number tree.
In the eighth step, this algorithm calculates the port customer loyalty with the frequent patterns of ships. In frequent patterns of ships, arrival times of the same ship company are added together. Total arrival times of frequent patterns are also counted. The ratio of arrival times of the same ship company and total arrival times of frequent patterns is the customer loyalty of a shipping company to a port. If the shipping company has a big percentage in frequent patterns of ships, it should be considered that it has a high loyalty to the port. Now, we introduce a formula to get the port customer loyalty of a shipping company as follows:
ATshipping_company is the arrival times of all ships belonging to a shipping company. ATAll_ships is the arrival times of total ships at a port.
The customer loyalty can be used to rank the shipping companies to obtain the list of port customer loyalty.
In the ninth step, the customer loyalties are ranked to form a list of loyal customers to a port. The first shipping company in the list is the most loyal customer to a port.
4. A Case Study to Apply the Algorithm
We studied a case that showed very good results as expected. Our AIS data covers the Taiwan Strait. We already had the OD data of ships for some ports in China. We considered one Chinese port among them to prove the performance of our algorithm proposed in this paper. The program implementing the algorithm was written in Python 2.7 and run on a computer with windows 10 and Intel I5. With the actual data, this case study showed our algorithm could get customer loyalty very well.
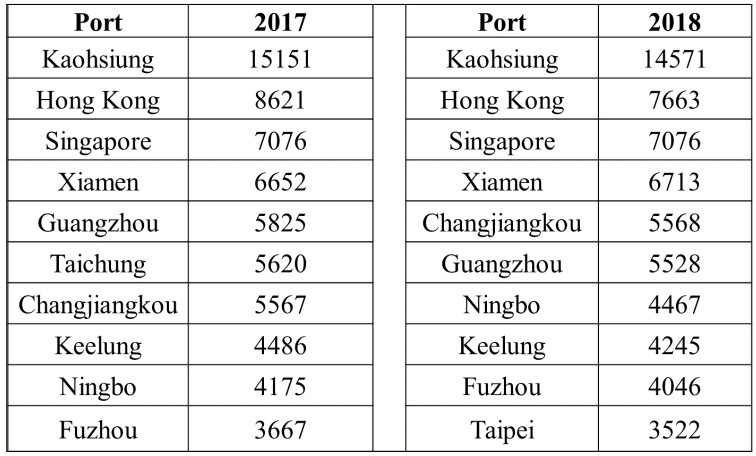
We made a table including the arrival times of ships at various Chinese ports during 2017 and 2018. We selected top ten ports for choosing a sample port of this experiment. Kaohsiung port achieved the highest arrival times of ships in 2017 and 2018 as shown in Table 1. Therefore, we chose the port to apply the algorithm to get the customer loyalty.

Arrival times of ships at ports in China in 2017 and 2018
In the first step, OD data were read. As the OD data included time factor, we clustered OD data into groups according to the date in the second step. The procedure is shown in Fig. 2. The IMO number was clustered by the same arrival date and port. The clustered OD data are shown in Table 2.

An example of grouping the OD data into a clustered data

A clustered data of Kaohsiung port in 2017
Step 3 counted the value of the arrival times of each ship in the clustered data and put data into an arrival times table in descending order of arrival times (Fig. 3).
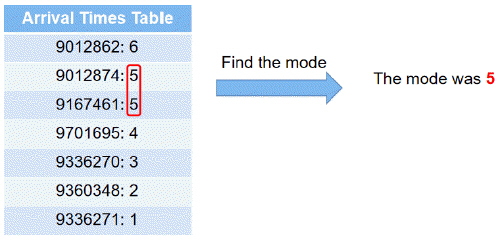
Finding the mode
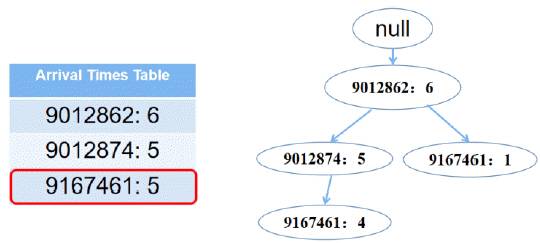
In Step 4, the mode of values in the arrival times table was looked for. In our example, the mode was calculated as 5 (Fig. 3).
In Step 5, the ships whose number of arrival times was less than the mode were deleted from the clustered data. The ships of 9701695, 9336270, 9360348, 9336271, and 9368314 were removed as shown in Fig. 4.
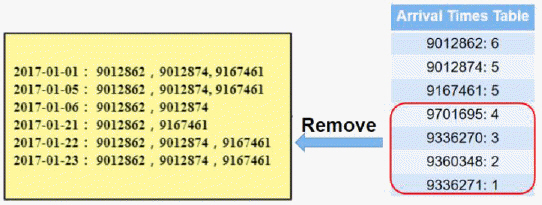
Removing ships from the clustered data
Now, as the step 6, an IMO number tree was created with a single null node. Each edge of the tree was all directional and points to a next ship with whose IMO number. For example, if the next IMO number was different from the previous IMO number, it was inserted into another branch node. Every data in the clustered data were inserted as a node in the IMO number tree. Nodes of 9012862, 9012874 and 9167461 were inserted into the IMO number tree as shown in Fig. 5.
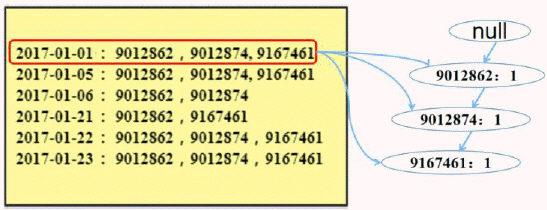
Making an IMO number tree
Fig. 6 shows the example of the entire arrival times table and the IMO number tree. Those were used to accelerate the FP-growth algorithm to mine the frequent patterns of ships quickly.
Finding the frequent patterns of 9167461 ship
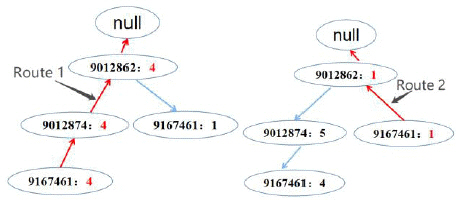
The step 7 was to mine the frequent patterns of ships from the bottom of the arrival times table. The direction of edges in the IMO number tree may be changed for mining the frequent patterns of ships. The route was defined as a path from a certain node to root. The red colored route was the mining path shown in Fig. 7. In this example, our algorithm looked for the frequent patterns of 9167461 ship. If the arrival times of 9167461 was 4, while the arrival times of 9012874 was 5, it means that the arrival times of 9012874 had only 4 times in a certain port with 9167461.
Mining the frequent patterns of ships
All the arrival times of ships on Route 1 were the same as the arrival times of 9167461 (Fig. 7). After then, our algorithm stored the new arrival times of ships on Route 1. In some ways, the arrival times of ships on Route 2 were also the same as the arrival times of 9167461 (Fig.7). Before mining the frequent patterns of ships in Route 2, the arrival times of ships on Route 1 had been stored. Table 3 shows the result of arrival times in different route.

A result of arrival times of 9167461
In the last case, the frequent patterns of 9012862 was mined by FP-growth algorithm. Fig. 8 shows that IMO number tree had only 9012862 except root. Therefore, we had the only frequent patterns of 9012862 for it had only one route to connect root. Therefore, the arrival times of 9012862 was still 6, which had not been changed. In consequence, the frequent patterns of ships of 9012862 had only itself because it had not child node.

Finding the frequent patterns of 9012874
Finally, we could get all frequent patterns in the IMO number tree based on the FP-growth algorithm.

A result of mining frequent patterns
After finding all the frequent patterns of ships, the null value of root could make the FP-growth algorithm terminate. The result of arrival times of 9167461, 9012874 and 9012862 is shown in Table 3.
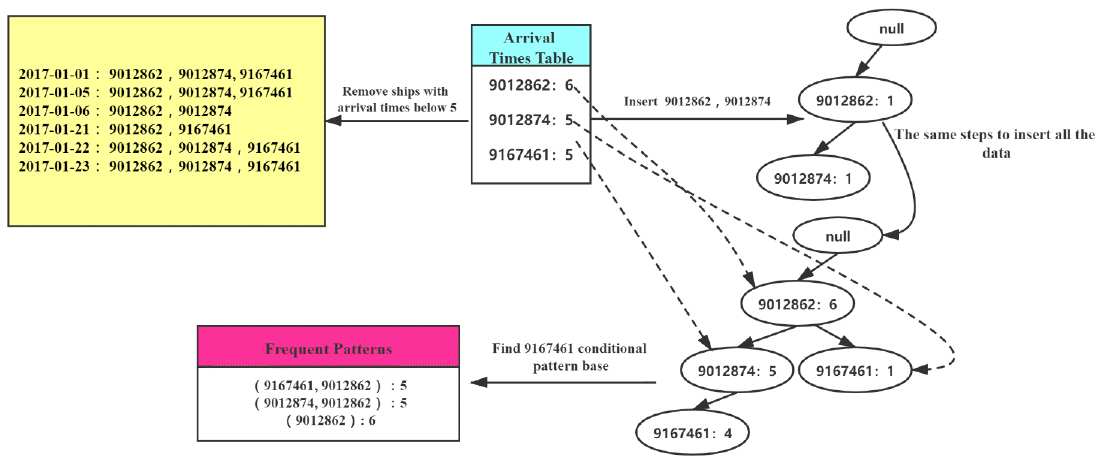
Fig. 9 shows the entire process of mining the frequent patterns of ships.
Full steps for mining processing of frequent patterns
After finding the mode, the ships with less frequencies than the mode that were removed. After removing the infrequent ships, the clustered data of frequent ships were inserted into the IMO number tree one by one. IMO number tree made nodes according to the clustered data. The different branch was made based on the values of branch nodes. The previous clustered data was in the left branch and the next clustered data was in the right branch. Next, the FP-growth algorithm searched the frequent patterns of ships from the bottom of the left branch of the IMO number tree.
The results of all routes were combined. In the same ways, our algorithm looked for the frequent patterns of remaining ships of the arrival times table. In the end, the FP-growth algorithm could mine all the frequent patterns of ships in the IMO number tree.
Therefore, a loyalty of shipping company could be calculated by the formula 1. In the same ways, the loyalty result of the shipping company B could be derived and that was shown in formula 2 and formula 3.
Before calculating customer loyalty, we could use the IMO number to get more information about ships. One of the most important information from the IMO number was the operating companies of the ships.
Therefore, we could get a list of loyal customers after carrying out step 9 as shown Table 5. We scaled up the results by 1000 times in this case because of the arrival times of some shipping companies were too few.

List of top 10 loyal customers of Kaohsiung port in 2017 and 2018
We had derived the top 10 shipping companies of Kaohsiung port. The result of port customer loyalty is shown in Table 5. In the table, names of shipping companies were blinded for privacy. The shipping companies like B, I and J are shown in the left of Table 5, but they are disappeared in 2018 case shown in the right of Table 5. The shipping companies like D, E and F obtained higher ranking than in 2017. The L, M and H shipping companies became new loyal customers to Kaohsiung port. The G shipping company was dropped by one position in the ranking.
The rank of the A shipping company has not been changed from 2017 to 2018 because the Ministry of Transportation and Communication of Chinese Taiwan was the largest shareholder of the company (Taiwan Navigation shipping company, 2020). A lot of valuable information could be mined in the list of port customer loyalty based on different demands.
We could easily find that the C shipping company was dropped from the third position in 2017 to the ninth position in 2018. Therefore, ports with competitive relations to Kaohsiung port, such as the Shanghai port, could use some price marketing strategies to attract the C shipping company to be their loyal customer.
5. Discussion
Port authorities can use the result of our method, the list of loyal customers. They may also get more precise ranking of loyal customers by combining the list with other information such as ship size, price and age etc. Meanwhile, they can research on ship companies of the list to revise port prices. The factors which may be involved in setting the price are those which regard costs, commercial viability, economic sensitivity, qualities and competition of services and the availability and occupation of infrastructures and equipment.
PA can provide the best quality of service to ship companies by using the list. They attract ship companies the availability and safety of good flows through marketing activities. In particular, they may customize the services in the quay, efficiency of storage, the speed in processing information and the abundance of room for storage and processing.
The list of port customer loyalty not only provides a target for other ports but also may give a chance to improve the competitiveness of ports for getting the new balance of the port markets.
The ship is an important factor of the port market, which is directly related to the shipping market. However, the factors influencing the shipping market are more complex. (Chen et al. 2015) considers the shipping market that is always in volatility according to complex impact factors. In addition, the port market can refer to the practices of other industries to improve customer loyalty. Our algorithm is designed to calculate port customer loyalty by mining the frequent pattern of ships so that we do not need to research complex impact factors.
In our case study, (9167461, 9012862) is the most frequent pattern of ships. They both come into Kaohsiung port for five times. As a matter of fact, their arrival times can over 50 times of the real data. They are the most important ships or shipping companies to the port, because they can make a large profit such as berthing fees, identify loyal port customer and calculate port customer loyalty.
(Lee et al. 2011) assesses the relationships to these constructs with the structural equation model, and the data collects from a questionnaire sent to Taiwanese have been importers for creating customer loyalty. But the application scenarios of each industry are different, so it is necessary to study the methods to improve customer loyalty for different industries. Some market strategies are made to improve the effectiveness of operation based on the ranking of the list. (Kim et al. 2014) investigates how the customer satisfaction and the switching barrier influence customer loyalty.
The research results are applied to improve customer loyalty. Like the C shipping company, it has lower port customer loyalty in 2018. Kaohsiung port may investigate the shipping company so that it may provide professional and accurate services to improve loyalty.
In the port market, ship companies choose a best service provider and actively switches from one service provider to another according to the best profit. In this fiercely competitive market, ship companies demand tailored products and better services at lower prices, while service providers constantly focus on acquisitions as their business goals. The competition is very high, so that moves to reduce customer loyalty.
Our loyal customer list can lead port authorities to develop strategies for maximizing their profit. PA can devote substantial efforts to developing and maintaining loyal customer lists and relationships. This loyal customer list gives PA an opportunity to recommend accurately port service or product through direct marketing method like e-mail.
PA may also provide loyal customers with discounts on services the customers purchase regularly as well as services that complement prior purchases. For example, the quarantine wash service that offers 3,000 dollars that gives a 10% discount to ship companies that uses frequently this service. It will certainly help PA create a loyal customer base to know the fact that they can get a better deal on a certain service. This list may make some important customer goals and reduce large works for a port. In addition, it greatly may improve the work efficiency of the port marketing department. Ports can focus on increasing customer loyalty by improving the service quality.
Only frequency information can be obtained from OD data, so more detailed information such as the capacity and cost of ships may be needed to distinguish frequent users more accurately. Other information may be used as weights to determine loyalty rankings such as the ship price which may improve the accuracy of the ranking list of loyal customers. Moreover, the ship type may also be used as another weight to get the loyalty list. PA can obtain a more detailed list of loyal customers according to the demand, so as to meet various needs of port strategy formulation.
6. Conclusion
A data mining algorithm based on the frequent patterns is proposed to get the loyalty of port customers. FP-growth algorithm is used to mine the frequent patterns of ships arriving at a certain port. Based on the frequent patterns of ships and the mode, a formula for customer loyalty of ports is also proposed. Compared with a variety of factors that affect the loyalty of port customers, this algorithm can quantify the loyalty degree of customers and measure it very well. It can also provide favorable support for ports to grasp important customers.
As an example, the AIS data of the Kaohsiung port in 2017 and 2018 were used to derive customer loyalty from the port. The shipping companies were compared in terms of port loyalty. Shipping companies whose loyalties has been dropped could be identified easily. This result may be used to attract companies to a certain port.
Next, further research will be the factors of the ship. The correlation coefficient method is made to calculate the numerical relationship between the number of ship arrivals and the factors affecting ship arrivals. We hope to find the affecting factor of arrival times in order to improve more competitiveness for ports. After then, the field investigation is carried out on these factors. The results of the investigation may provide data support for preliminary planning of ports. This result can also be used to improve customer relationship management so as to increase core competitiveness. The final goal is to increase the market by attracting new customers, retaining existing customers and converting existing customers to loyal customers.
However, the frequency information may not be the sufficient factor to derive customer loyalty precisely. The other information such as ship size, type, and cost may be considered to increase the accuracy of the results. That will be one of major issues in the next phase of our research.