An Experimental Study on the Motion of the Floater Moored near Port in Waves Generated by a Ship
Article information
Abstract
In the past, various research on the effects of waves generated by ships has been investigated. The most noticeable effect of the waves generated by a passing ship is the increase of the hydrodynamic forces and the unwanted large motion of the moored ship and high mooring forces that occur. Thus, it is crucial to investigate the effect of the waves generated by the passing ship near port on the motion of the moored ship and the tension of the mooring lines. A model test was performed with virtual ship-generated waves in a square tank at CWNU (Changwon National University). The IMU (Inertial Measurement Unit) and Optical-based system were used to measure the 6DOF (Six Degrees of Freedom) motion of the moored floater. Additionally the tension of mooring lines were measured by the tension gauges. The effects of the wave direction and wave height generated by the virtual ship-generated waves on the motion of the moored floater were analyzed.
1. Introduction
When the ship near port can be influenced by the wave generated by the passing ships. The wave generated by the passing ship can induces the hydrodynamic forces acting on the moored ship near the port. It is necessary to investigate the motion of the moored ship due to wave generated by a small boat. In the past, there were various researchers investigating the effect of ship-generated waves. Remery(1974) carried out the model test in waves and current to estimate the external forces on a tanker, moored in shallow water. He analyzed the main effect of passing distance, ship speed and size of passing tanker. Vantorre et al.(2002) performed the model test in Flanders Hydraulics to predict the ship-ship interaction forces for including into the mathematical model of maneuvering simulators. Pinkster(2004) studied on the influence of passing ships on the hydrodynamic forces of ships moored in the restricted waters. Nam and Park(2018) developed a numerical method to study on the passing ship problem with a moored barge. They only focused on the hydrodynamic forces of the moored barge due to the passing ship. Pawar et al.(2018) used RANS method to estimate the hydrodynamic forces on the moored ship for analyzing the effect of various parameters such sailing line distance, water depth and speed of a passing ship. Generally, all of the abovementioned approaches have some limitations because the ship-generated wave is affected by the distance from sailing line, ship speed, type and size of passing ship, the unwanted large motion of the moored ship and the high mooring forces can occur. Through the model test in virtual ship-generated waves, the effect of wave directions, ship speed of passing ship on ship motion of the moored ship can be found. This is the motivation to carry out the presented research. The objective of this study is to investigate the motion of the moored floater in the virtual ship-generated waves. The model test was carried out in the various wave direction of virtual ship-generated waves. IMU and Optical-based system are to measure the 6DOF motion of the moored floater in wave generated by a small boat. Moreover, the tension of mooring lines of the moored ship is analyzed.
2. Background of ship-generated wave and experimental method
2.1 Ship-generated wave
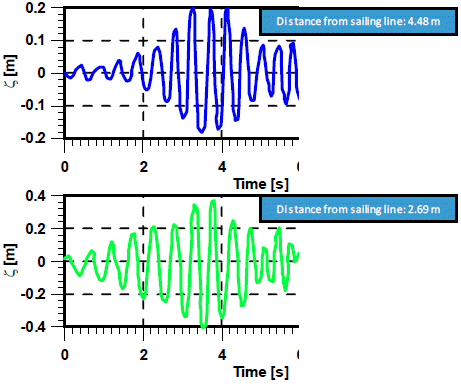
The main features of the ship-generated wave has been studied by Froude(1877), Sorensen(1966) and Das(1969). Fig. 1 shows the time histories of the water surface at different locations to the sailing line in waves generated by a model cruiser. In addition, Sorensen (1966) performed the experiment for investigating the maximum wave height generated by the various vessels as shown in Fig. 2. In his study, the amplitude of the waves generated depends more strongly on the speed of the ship and the depth of water than on the shape of the hull.
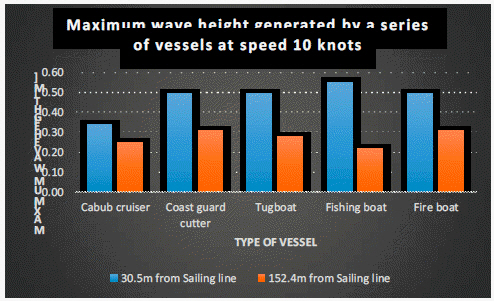
Maximum wave height of ship generated wave (Sorensen, 1966)
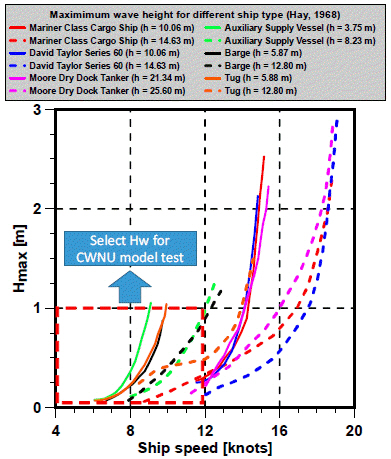
Fig. 3 shows the maximum wave height measured by wave gauges positioned at a distance from a sailing line of 0.5 times of the model ship's length. Hmax and h are the maximum wave height and water depth, respectively. Hay (1968) concluded that smaller vessels may produced waves comparable in height to the waves produced by a large vessel and Hmax increases with decreasing water depth. Therefore, in this study, we choose the range of ship speed from 4 knots to 12 knots for investigating the effect of ship-generated wave near the port.
2.2 Experimental method
The IMU was used to measure the attitude (roll, pitch and yaw), and acceleration of the moored ship. A spring suspended mass in a housing will be displaced when subjected to a force. The displacement is proportional to the specific force and can be measured. Accelerometers measured the difference between body acceleration and gravity. For gyroscopes, a mass is actuated to vibrate in direction ract and a displacement is measured in perpendicular direction rcor. An angular velocity ω, perpendicular to the plane induces a Coriolis force, which results in a proportional displacement along rcor . From this ω can be can be estimated, then the attitude (roll, pitch and yaw) can be estimated by integration of ω.
The Optical-based system was used to measure the 6DOF of the moored ship near the port. Filho(2005) introduced the detail theory and implementation of optical motion capture to record the motion of the rigid body. Fig. 4 shows the way in which 6DOF of the ship are measured using Optical-based system. Overall, there are four stages in the process of 6DOF measurement. To begin, Image Aquisition used to capture the images by using OptiTrack Cameras. Following this, the marker detection used to detect the position of markers in the real time. Motive software assistants in this process by using auto labeling. Auto labeling consists in determining which detected points corresponding to each of the markers in capture images After initial labeling in the first frame, automatic labeling on the following frames will be automatically updated. Spherical markers were used for tracking objects, these are treated as points without volume. The most advantaged technologies are capable of tracking of motion with high precision at very high sampling rates. Next, 3D (three-dimensional) position reconstruction used to derive 3D points from 2D (two-dimensional) coordinated obtained by capturing camera images. 3D position reconstruction concerns in establishing matches between markers detected in the image of different views. Space resection, which is one the standard orientation tasks of photogrammetry and computer vision assists in this process. If the makers are detected on a image, its 2D point locations are determined in an image plane. Space resection is used to reconstruct 3D position of markers from 2D coordinated obtained by capturing camera images. In the subsequent stage, the 6DOF of the ship in waves is obtained. The commercial software Motive which was developed by NaturalPoint was used to obtain the 6DOF of the ship.

Measurement processing of 6DOF of the rigid body
3. Test facilities and test conditions
3.1 Test facilities
The experiment was performed in the square tank in CWNU as shown in Fig. 5. In this experiment, the motion of 6DOF motion of the moored floater was measured by the Optical-based system which were made by the NaturalPoint company. The tension gauge was used to measure the tension of mooring line. In addition, the attitude, acceleration of the moored floater were measured by an IMU. The device used in the present experiment is show in Table 1.
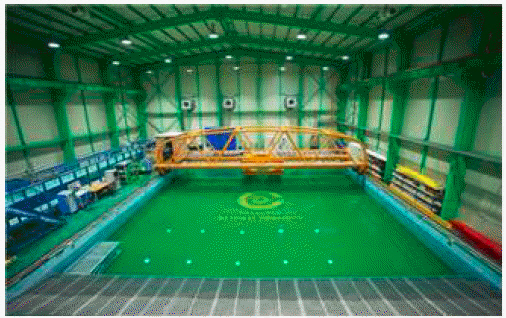
Square tank in CWNU

Device used in this experiment
3.2 Test conditions
The principal particulars of the real moored floater and the scale moored floater are listed in Table. 2. Fig. 6 shows the moored floater which used in this experiment.

Principal particulars of the moored floater
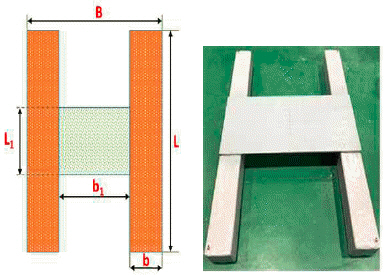
Model of the moored floater
Wave velocity for wave in deep water can be estimated using Eq. (1). Sorensen(1993) proposed the method for estimating phase velocity for wave generated by the ship by Eq. (2). V is the ship speed and θ is the angle between the direction of wave propagation and the sailing line as shown in Fig. 7. Then, the wave frequency for real ship can be estimated by Eq. (3). The model scale and the wave frequency of the moored floater can be estimated by Eqs. (4-5).
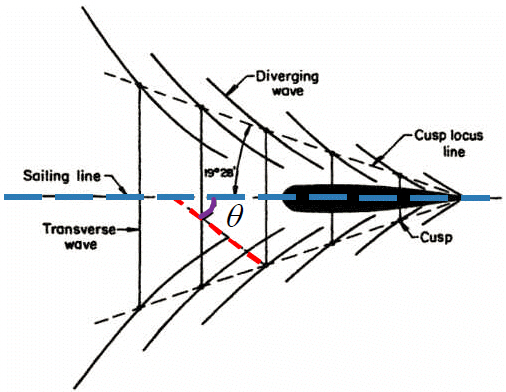
Wave crest generated at bow of moving vessel (Sorensen, 1993)
where,
λ is scale ratio, Lm and Ls are length of the model and the ship, respectively. ωm and ωs are wave frequency of the model and the ship, respectively. In order to achieve the dynamic similarity of the mooring lines, the diameter and the stiffness of model mooring lines are chosen as listed in Table 3. do and K represent the diameter and the stiffness of the mooring lines, respectively. Subscripts s and m are the real and the model, respectively. The ratio between diameter of the model mooring lines dom and the diameter of the real mooring lines dos are estimated by Eq. (6). The ratio between the stiffness of the model mooring lines Km and the stiffness of the real mooring lines Ks can be estimated by Eq. (7) suggested by Bergdahl et al.(2016).

Principal particulars of mooring lines
where,
Wave celerity c is the propagation celerity of longitudinal elastic waves. Cυm and Cυs are the volume coefficient of the model mooring lines and the volume coefficient of the real mooring lines, respectively. γ0 is the mass of the mooring line per unit length. Cγ and ρc are a volume coefficient (Cυ = 1) and densities of the mooring lines (ρc = 8000 kg/m3).
Maximum wave height of the wave generated by the ship near port is selected based on experimental results of Hay(1968) and Sorensen(1966). Then, the maximum wave height of the wave generated by the ship for the model test can be estimated. Wave conditions for the model test is listed in Table 4.

Wave conditions
4. Experiment
4.1 Pre-test
Before performing the experiment, the mass distribution of the moored floater was checked to an exact match with the real ship. Figs. 8-10 show the ballasting of the moored floater and the inertial test. The result of the inertia test is listed in Table 5.

Ballasting of the moored floater
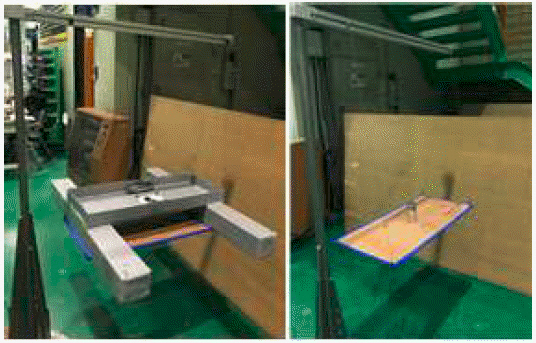
Inertia test of the moored floater for kyy

Result of the inertia test
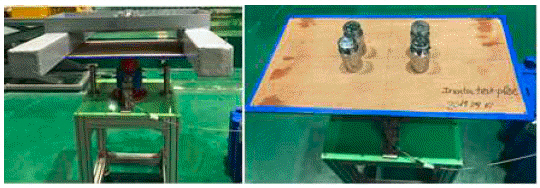
Inertia test of the moored floater for kzz
Because the focus of this study is to investigate the effects of the waves generated by the passing ship, it is necessary to check the quality of the virtual ship-generated wave. Fig. 11 shows the experimental arrangement for measuring the waves generated by the wave maker. In this experiment, the waves were checked at the location where the floater model will be placed. Fig. 12 shows the wave height measured at the point where the test model will be placed. It can see that the wave shape is similar to the wave shape created by the passing ship as in the research of Das(1969). Fig. 13 shows the analyzing of the measured data to check height of the generated waves. The difference between the generated waves and the target wave height is very small, only about 1% as listed in Table 6.
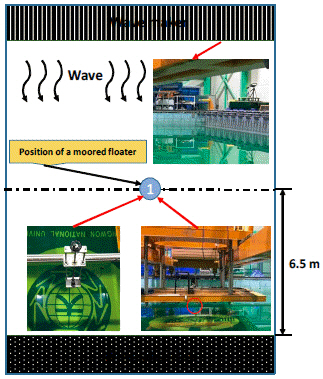
Experimental setup of wave test
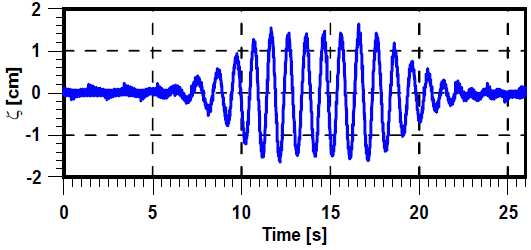
Time history of virtual ship-generated wave at target wave height 2.8 cm
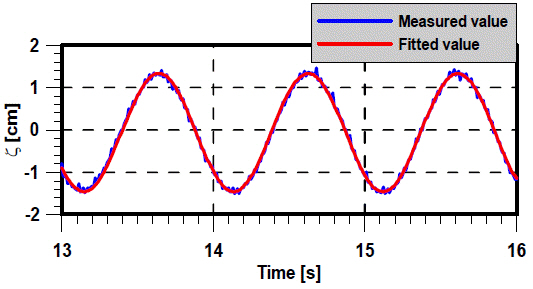
Analyzing of virtual ship generated wave at target wave height 2.8 cm

Result of wave test
4.2 Experimental setup
The moored floater was attached to the tension gauge and the mooring lines connect with the mobile port inside the middle of the mobile port. The motion of the moored floater is measured by the IMU and OptiTrack device, the tension of the mooring line is measured by four tension gauges. In this experiment, the mobile port is rotated to change the direction of the virtual ship-generated wave. The detailed setup of this experiment is shown in Fig. 14. The diagram of experimental setup for 160 degrees, 140 degrees and 120 degrees are shown in Fig. 15. In addition, the experimental setup for 180 degrees is shown in Fig. 16.

Diagram of experimental setup

Diagram of experimental setup (Unit: m)

Experimental setup at 180 degrees
4.3. Data analysis
The time series were recorded when the it occurs the wave near the moored floater. In addition, after each run the data were inspected in the time domain to check for the obvious error. The signals output from the OptiTrack device are measured based on the recording the motion of three markers and the attitude is the quaternion. Then, the signals output from OptiTrack device was transformed to Euler angle. In this experiment, the measured data was analyzed by on the flow chart in Fig. 17 for finding the maximum value of displacement, attitude and acceleration of the moored floater and the tension of mooring lines.
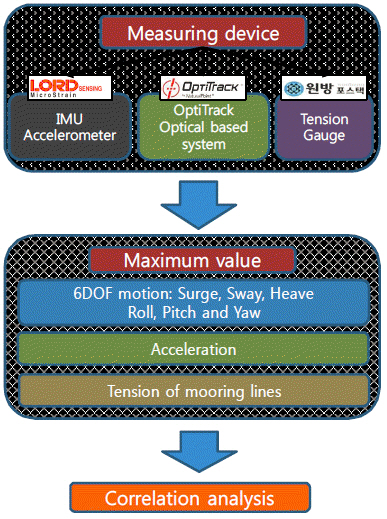
Flow chart for data analysis
Natural frequency of the moored floater can be estimated by measuring the time lapse and the logarithm decrement between the consecutive peaks of the trace of free-decay time history. Fig. 18 shows the result of the free pitch decay test. The result of natural frequency of heave, roll and pitch of the moored floater are listed in Table 7.

Free pitch decay test

Result of wave test
In this study, the most sensitive variable with the acceleration of the moored floater and the tension of the mooring line can be determined by the correlation analysis. The correlation of ship's acceleration or the tension of the mooring line are determined by Eq. (8).
where, xi is a motion variable of the moored floater. In addition, yi is mooring tension or acceleration in x, y, and z direction. x and y are the mean of the x and y, respectively.
5. Result and discussion
5.1 Motion of the moored floater
The time histories of the attitude signal from IMU and OptiTrack in 140 degrees are compared at 10 knots as shown in Fig. 19. The trend and the value of the attitude from IMU and OptiTrack are the same, so we will choose the value from OptiTrack for further discussion.

Comparison of time histories of attitude of the moored floater at 140 degrees
The maximum displacement and attitude of the moored floater is shown in Fig. 20. The surge and heave are dominant in head wave and sway becomes largest in oblique waves. It is because the surge and heave are well correlated with the vertical motion of the water surface in head waves and the moored floater moves initially surge backward away from the ship generated waves before going forward. However, in case of oblique waves, the ship-generated wave moves excursion to the moored floater. Therefore, sway is significantly larger than the response in surge or heave in oblique wave. Especially, in case of 120 degrees, sway of the moored floater changes slightly when the wave height of the wave generated by the ship increases. It is because the moored floater moves initially sway backward away from the ship-generated wave before going forward. The displacements are the largest in highest wave height. It mean that the displacements of the moored floater are strongly dependent on the speed of the passing ship and direction of the ship-generated wave.
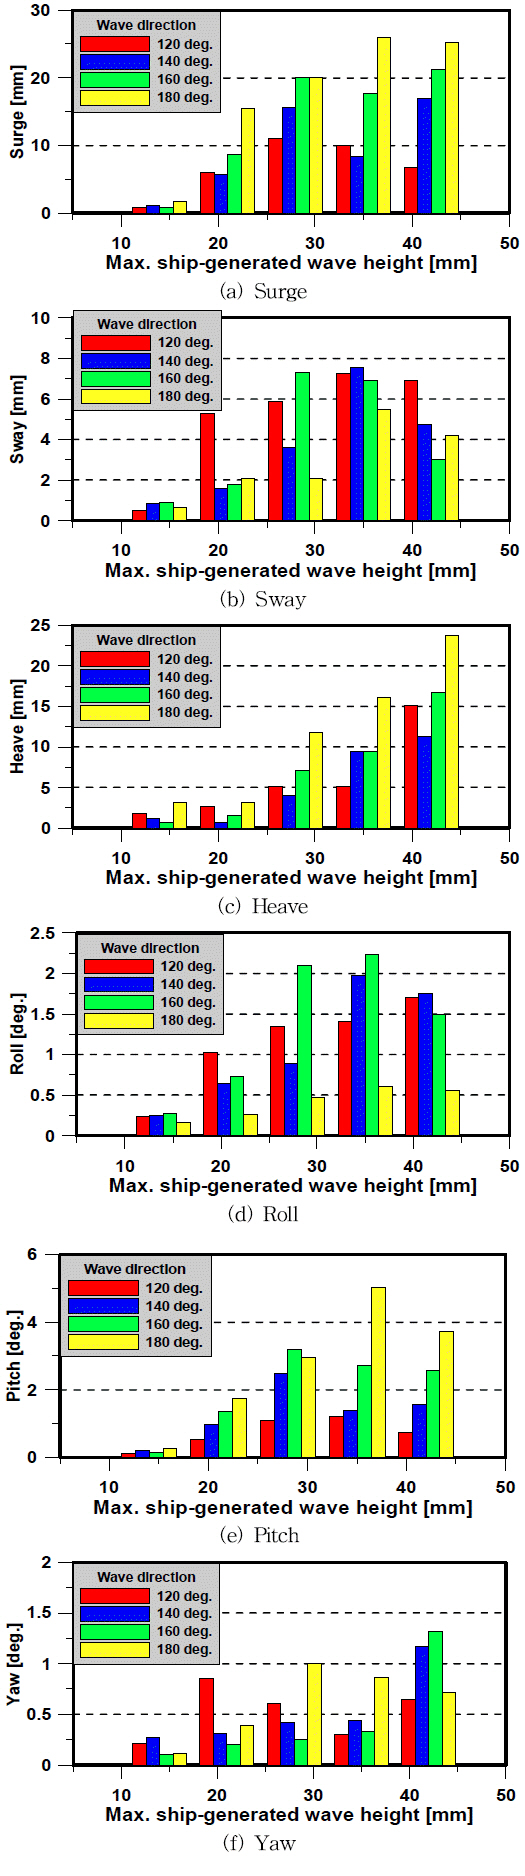
Maximum motion of the moored floater
The maximum of roll and pitch of the moored floater becomes largest in highest wave height and changes slightly in case of 120 degrees. Although the wave height created by the ship increases, the maximum motion only appears at the wave height corresponding to the speed of the passing ship is 12 knots. It is because wave frequency of the ship-generated wave happens near the natural frequency of roll and pitch. Pitch is dominant in head wave and yaw becomes largest in oblique waves. Yaw of the moored floater is the smallest in the case of head sea and smallest wave height. This may be due to the effect of the direction of the ship-generated wave, since it pushes the moored floater against the mooring lines due to the wave propagating away from the passing ship. Maximum surge occurs and is coupled with the maximum pitch of the moored floater. In addition, the maximum sway is coupled will roll of the moored floater, while the maximum heave is coupled with the majority of the motion of the moored floater. It clear that the motions of the moored floater depend on not only the speed of the passing ship (highest virtual ship-generated wave) but also the direction of the ship-generated wave.
5.2 Acceleration of the moored floater
Fig. 21 shows the maximum acceleration of the moored floater in various directions. In head wave, the surge acceleration becomes largest and sway acceleration and heave acceleration becomes largest in oblique waves. Maximum acceleration of the moored floater in three directions are strongly coupled with surge, sway and heave of the moored floater. The effect of coupling on acceleration of the moored floater is discussed in a later section.

Maximum acceleration of the moored floater
5.3 Tension of the mooring line
The maximum tension of the mooring lines are shown in Fig. 22. The maximum value of the tension of the mooring lines at stern occurs in highest wave height and in 180 degrees and 160 degrees. It is because the tension of mooring lines mostly depend on the horizontal and the vertical motion of surge, sway and heave as shown in Fig. 20. It suggested that the safety assessment of the tension of mooring lines due to effect of the ship-generated wave should be analyzed by investigating the maximum of the horizontal and the vertical motion of the moored floater.
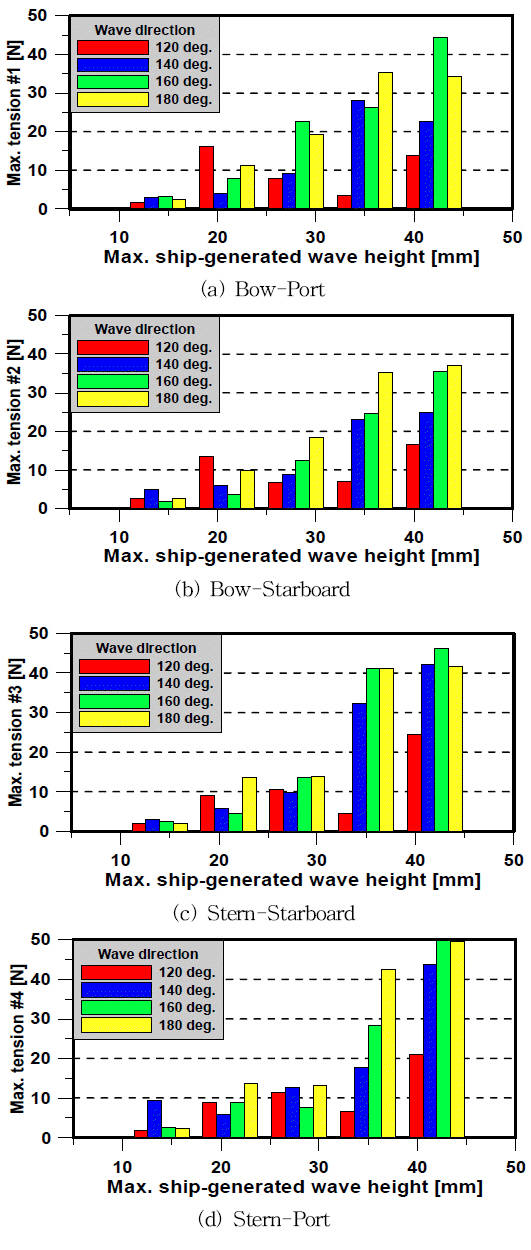
Tension of the mooring lines
5.4 Correlation analysis
Fig. 23 shows the correlation coefficient of the acceleration in three directions, respectively. It can be seen that the maximum accelerations of the moored floater depend on the speed of the passing ship (highest virtual ship-generated waves). Surge is the most sensitive motion with surge acceleration in head wave. Sway is the most sensitive motion with sway acceleration while heave is the most sensitive motion with heave acceleration in head wave. It is because the maximum acceleration increases or decreases, in relation to the displacements of the moored floater, depending on the direction and the amplitude of the ship-generated wave. For example, surge and heave of the moored floater are well correlated with the longitudinal and vertical motion of the water surface in head wave due to the effect of the wave propagating away from the passing ship. Nevertheless, heave and yaw are the most sensitive motion with sway acceleration in oblique wave. Surge, heave and yaw are the most sensitive motion with heave acceleration in oblique wave. It is because the oblique wave propagating away from the passing ship causes the greater motion in horizontal and vertical direction which are coupled with surge, sway and heave. Therefore, the attitude of the moored floater in oblique wave also associated with the acceleration.
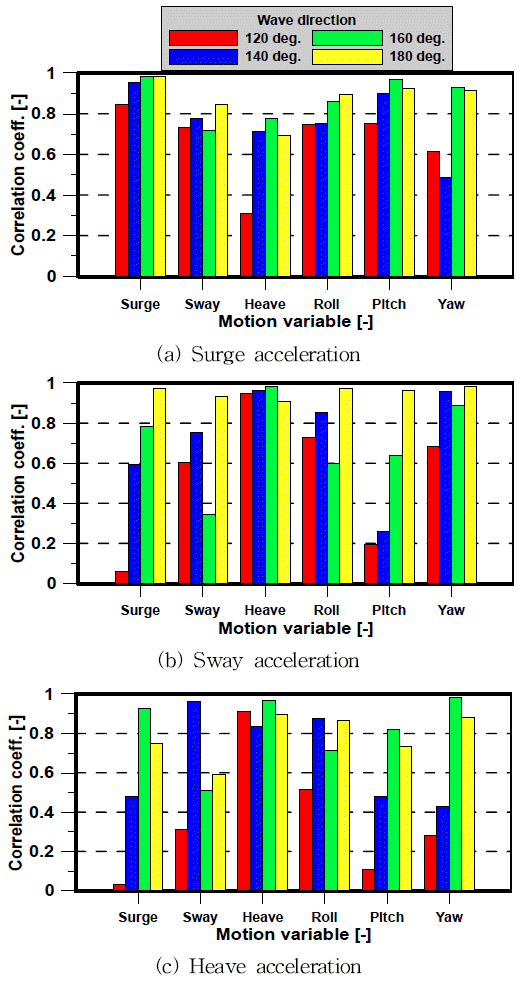
Correlation coefficient of acceleration of the moored floater
Fig. 24 shows the correlation coefficient of the mooring lines at bow and stern. Heave and heave acceleration are the most sensitive motion with the tension of the mooring lines. It is because heave is well correlated with the vertical motion of the water surface generated by the passing ship. The moored floater moves initially heave upward away from water surface before going downward. Then, the restoring force due to mooring lines becomes greater. In the intial design state of mooring lines, the safety assessment of the tension of mooring lines due to the effect of the ship-generated wave should be considered and the moored of floater breaks away from the mooring lines due to the passing ship can be prevented.
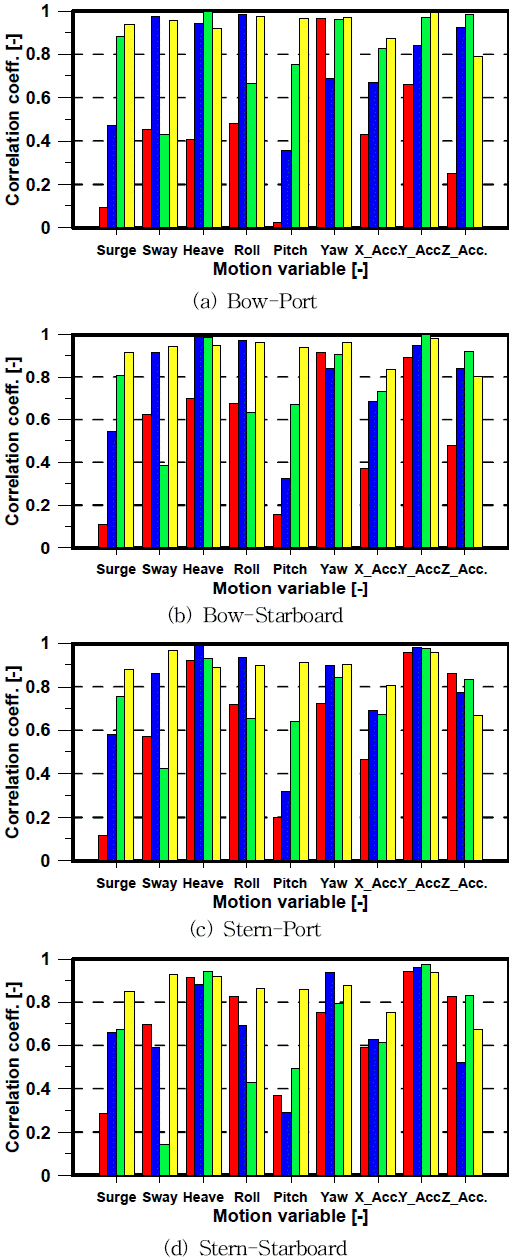
Correlation coefficient of the tension of the mooring lines
6. Conclusion
In this paper, the model test of the moored floater near port in the virtual ship generated wave was conducted in Changwon National University’s square tank and the 6DOF motion, acceleration of the moored floater and the tension of mooring lines were investigated. The concluding remarks are as follows:
First, the effect of the virtual ship generated waves by a small boat on the motion of the moored floater are dramatic. Surge and heave become largest in head wave while sway becomes largest in oblique waves. In addition, pitch becomes largest in head wave and largest yaw occurs in oblique waves. The unwanted large motion of the moored floater is strongly dependent on the wave height and the direction of the ship-generated waves.
Second, the surge acceleration of the moored floater becomes largest in head wave. It is due to surge of the moored floater is dominant. Sway acceleration and heave acceleration become largest in oblique waves. It is due to sway and heave of a moored floater are dominant.
Finally, the maximum tension of mooring lines at stern occur in high wave height corresponding the high speed of the passing ship in 180 degrees and 160 degrees. The highest tension of the mooring lines is strongly dependent on the speed of the passing ship and the wave propagating away from the passing ship. In this study, all investigations were conducted with respect to the moored floater. Thus, investigations involving other type of ships could be a topic for future research.
Acknowledgements
This research is financially supported by Changwon National University in 2019~2020.