An Analysis of the Mediterranean Cruise Ports’ Network Using Social Network Analysis
Article information
Abstract
The cruise industry in the Mediterranean region increased from 2000-2018, being the second most important region after the Caribbean. The purpose of this study was to analyze the networks and hub ports of the Mediterranean. This paper used the SNA (Social Network Analysis) methodology, which includes Hub and Authority Combined Centrality (HACC) that has been used to analyze cruise port centrality, as well as degree centrality such as In-Degree, Out-Degree, and Betweenness. This empirical study suggests that the top three ports of the Mediterranean ports’ network in terms of hub index are Barcelona, Civitavecchia, and Palma de Mallorca. The academic implications are the suggestion for data integration based on real itineraries and numbers of POC (Port of Calls), as well as the selection of the hubs of the targeted areas. The practical implications are suggested such as a clear requirement for cruise industry, as a way to widen the scope for the Mediterranean region and a valuable reference for cruise ship companies to select the best fit home ports.
1. Introduction
The Cruise industry is considered a type of tourism that specializes in a mass-tourism base, being also a special type of tourism due to the facility of going to diverse places while staying in a floating hotel(Ehtiyar, 2016).
It started from the end of the 1960s, and nowadays, the cruise industry has had a great economic impact, with 26.7 million passengers, 1.1 million jobs and $45.6 billion in wages and salaries. This industry has resulted as a $134 billion total output worldwide in year 2017, most of the passengers came from the United States followed by China, Germany and United Kingdom(CLIA, 2018).
Being the second region in the world with 15.8% of the cruise tourism(MedCruise, 2018), the Mediterranean area is also regarded as a perfect place to go through to visit. The cruise industry has been a boost for the European industry (Esteve-Perez et al, 2018). This region includes numerous countries, which have cultural and ancient historical centers where ancient cultures converged. Due to this fact the Mediterranean area is differentiated from the Caribbean area which is more centered in a “fun-sun-sea” type of cruise tourism(Soriani et al, 2009). Another factor that is considered to boost the cruise industry in the Mediterranean region is the climate, which is warm and mild for most part of the year making it possible to navigate the area for up to 8 months. This creates the possibility for the cruise tourism to be directed in different themes depending of the route selected. Socio-economically, the Mediterranean has directly or indirectly the most powerful economies(Soriani et al., 2009).
Despite this importance, the previous research about the cruise industry of the Mediterranean area can be classified in customer satisfaction (Lebrun, 2015; Brida et al., 2014), economic tourism impact (Cusano et al., 2017), geographical advantage of the region (Charlier, 2004; Dehoorne et al., 2011; Marcussen, 2017; Pallis et al., 2004; Soriani, et al., 2009) and port selection (Lekakou et al., 2009). There are scant of papers using SNA (Social Network Analysis) for analysis of the cruise industry networks, moreover not centered in the Mediterranean region. This paper is more focused in the relationship among the nodes and the importance of the nodes in the cruise ports network. In this respect, the aim of this paper is to investigate this relation and how the nodes are connected and which ones are the most important.
With the identification of the hubs and authority ports in the Mediterranean region, we can determine which ports attract more cruise lines and which ones are more popular for the cruise tourists(Lekakow et al., 2009). The methodology used in this paper is SNA, which was chosen because the node connection can be seen easily as well as the importance and influence of them on the node networks is clearly found out. This paper is divided into five sections, the current section, introduction followed by the literature review section. The third section is methodology where SNA is explained. The fourth section, case study in which the cruise ports are studied, and the 24 most important ports in the Mediterranean are scored and ranked using Hub and Authority Combined Centrality(HACC). And lastly, the section of conclusion where the results are discussed as well as the implication are suggested.
2. Literature Review
Stojanovic et al.(2014) states that the cruise market is constantly increasing and the European market is divided in north European and Mediterranean market. The purpose of their paper is to highlight the influential factors and circumstances of the current flow of passengers that can affect further dynamics as well as forecast the development of the region. Greenwood et al.(2006) analyze the luxury cruise’s itinerary. This is important not only for the selection of right ports for the level of the cruise also, for the length of the cruise, the luxury cruises tend to be longer.
There are other authors that are more centered in the evolution and geography of the Mediterranean cruise ports, such as Barron et al.(2006) and Charlier(2004). Dehoorne et al.(2011), Marcussen(2017), Pallis, et al.(2004) Soriani et al.(2009) discuss about the cruise evolution and the influence in the world as well as the challenges and changes the cruise industry has to have and also, which regions are the best considered and why.
As to the economic implication of the cruise industry, Soriani et al.(2009) investigates the evolution of the global supply, demand and characteristics of the Mediterranean region. Jones(2011) did study of the motivation to cruise and the origin of the major tourists. Lekakou et al.(2010) suggested the factors to select the European homeports.
Some others are more centered in the passenger’s opinion and the importance of the cruise ports as well as the cruisers and non-cruisers vision. Lebrun(2015) and Brida et al.(2013) approached social representations of a cruise to understand better what influence cruisers and non-cruisers to cruise and the future behavioral choice. Rosa-Jimenez et al.(2018) focuses on the territorial effects of cruise activity on its main port cities and evolution of urban scenarios as well as transportation.
There are not many papers using SNA for the cruise industry, moreover not centered in the Mediterranean. This paper is to analyze the cruise ports’ network, connection of ports, and importance of ports using SNA.
3. Methodology
The SNA is a methodology used to analyze the networks(Zhang et al., 2010). The SNA analysis is formed by centrality concepts such as In-Degree, Out-Degree and Betweenness. In-degree centrality is specified how many nodes are connected to the actual node (Freeman, 1978); Out-Degree centrality on the other hand, explains how many nodes are connected out to other nodes from the actual node. So, if node i and j are connected, aij is 1: if not, is 0. (Jia et al., 2014).
Betweeness centrality calculates rate of the shortest paths between any two nodes that passes between two nodes. It is useful to know how much the current nodes can be an agent function in the network. If the current node’s betweenness centrality is high, it means that they can be used as a bridge node. gjk is the number that represents the shortest distance between gj and gk while passing node i. Betweenness is defined as follow(Song and Yeo, 2017):
Usually, the Hub and Authority Combined Centrality (HACC) are used together, as the in-degree and out-degree centralities are too. HACC has been considered as a supplement to the degree centrality made by Kleinberg (1999). They calculated the nodes’ priorities using the values of in-degree and out-degree centrality. The HACC of respectively each node is calculated by using a mutual reinforcement relationship. Mutual reinforcement occurs if a high hub centrality node connects to a high authority node, and a high authority centrality node connects to a high hub centrality node.
They are calculated as follow(Kleinberg, 1999):
The nodes that have a larger x and y value as being “higher” HACC. Additionally, if the node i serves as connection with many nodes with a high x value, then it should be obtained also a high y value. And if node i is connected with nodes with high y values, then i node should obtain a high x value.
4. Case study
The SNA is focused to analyze the patterns of connection. In this paper, the relationship between the itineraries and the cruise ports in the Mediterranean Sea was analyzed using degree centrality and HACC. The itineraries from 1st of January to 31st of December 2018 from 860 ports were used.
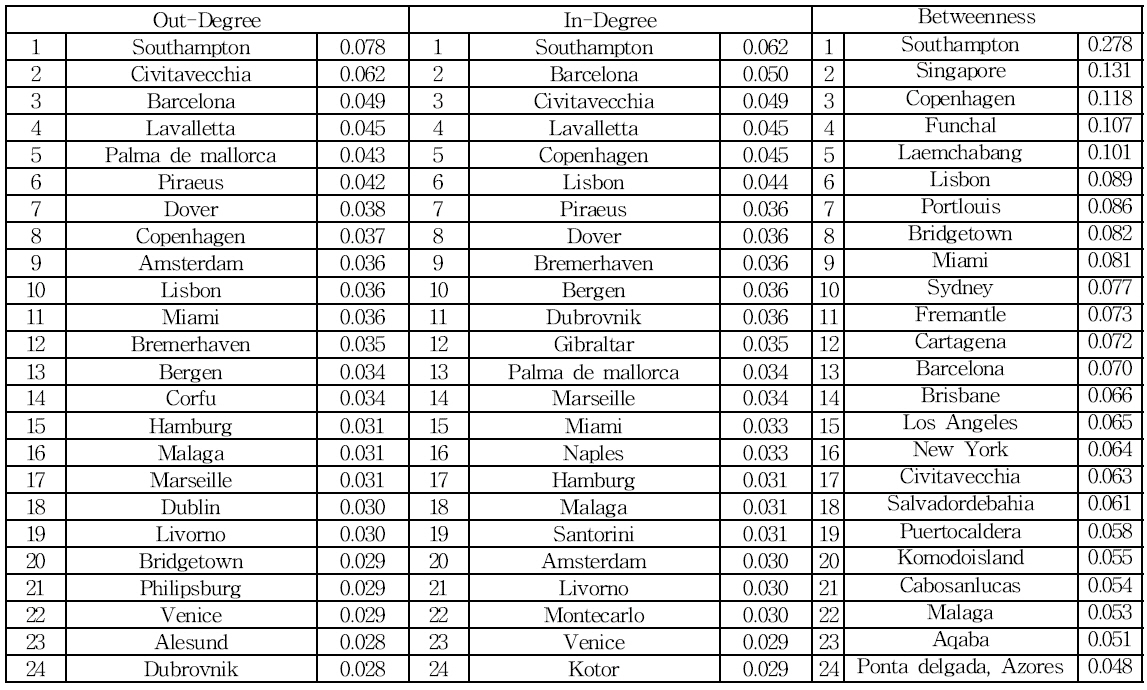
In terms of value, for the Out-Degree centrality, that was analyzed first, Southampton is ranked the first with a value of 0.078, followed by Civitavecchia that has a value of 0.062, Barcelona with a value of 0.049, followed by La Valletta with 0.045 and Palma de Mallorca as the fifth with a value of 0.043. In this case, having a high Out-Degree value means that port has a high number of departures.
Southampton as one of the main homeports in the area, and the start and end of the network and the connection of the area with other areas such as the Northern part, has a high number of departures, also is one of the best considered ports in Europe. Civitavecchia as well is a gateway port, it frequently connects the Western and Eastern region of the Mediterranean area, due to its closeness to the capital, Rome, and also, to other countries such as Spain, Malta and Greece connects main ports as Barcelona, Palma de Mallorca, Piraeus and La Valletta.
Barcelona even if it has less out degree centrality than Civitavecchia also is frequently used as starting point from the Western part of Europe and also is used frequently where people depart to go to other popular ports such as Palma de Mallorca and Civitavecchia with which it has a strong relation. La Valletta and Palma de Mallorca follow them with a similar value, due to its touristic flow, they are also used not only as gateway ports to reach another ports, they are also quite prestigious for the inner tourism.
In terms of In-Degree, Southampton is the first ranked port again with a value of 0.062, this indicates that Southampton is not only used for the departing vessels also, it has a high frequency of vessels, making it a prestigious port that many cruise choose. Following Southampton, in this case, with a value of 0.05, Barcelona port has a high in degree value, meaning that it has more arrivals compared to the departure number, making it a widely chosen port for the cruise companies, with a high touristic popularity.
It is followed by Civitavecchia that has a value of 0.049, really close to the Barcelona port, Civitavecchia is also known to be a prestigious port and is widely chosen for the route making, it one of the most popular ports for the Mediterranean. La Valletta has a value of 0.045, as well as Copenhagen that has the same value. As well as La Valletta, that is really popular during the summer vacations, and is one of the most chosen during this season.
For the Betweenness centrality, Southampton is still the number one with a value of 0.278, indicating that Southampton is frequently used as a connection as the shortest path, followed by Singapore with a value of 0.131, Singapore is considered one of the biggest hubs in Asia, and is a big connecting port from the Asian are to other as the European. It is followed by Copenhagen, 0.118 that is a Hub in Europe and is a really prestigious port, frequently a nexus to other areas of Europe.
The Out-degree, In-degree and Betweenness centralities values are really connected to the hub and authority values that are part of the hub index that indicates which ports are hubs in the network, and even if the values can be different from the final hub index value, this is because, for the calculation of the hub index not only the POC number is needed, also the degree centralities.
The cruise industry in the Mediterranean region has a great impact in the economy, bringing a great number of passengers and fomenting the tourism, leading to an increase in sales for the business’s around the ports and making the country known through the cruise itinerary. Even though, the global economic crisis impacted greatly the economies of the Mediterranean area, the cruise industry experimented an increase of passengers and itineraries, leading to the necessity to analyze the cruise industry hub and authority network due to the limited papers that are focused in the network.

Result of centrality
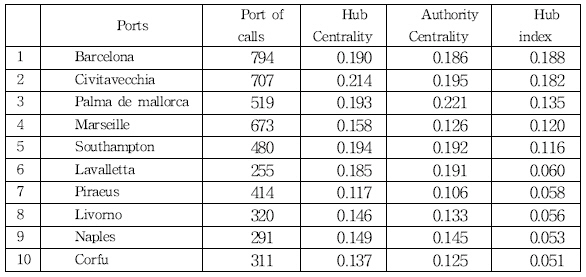
This paper focuses in the analysis of the hub and authority network as well as the in degree and out degree centrality, that focuses in the number of vessels that go and from the ports and how the port’s are connected. In this study, the results are as follows: for the hub centrality, Civitavecchia has a value of 0.214, Barcelona and Palma de Mallorca 0.190, Marseille 0.158, Southampton 0.194 and La Valletta 0.191. This indicates that these ports have a great popularity in the cruise network routes, Civitavecchia as a gateway and also congested port as well as one of the biggest hub ports have the highest value, also in terms of authority centrality Civitavecchia ranked first one with 0.195 followed by Barcelona(0.186), Palma de Mallorca(0.221), Marseille(0.126), Southampton(0.192) and La Valletta(0.191).
Despite this, for the hub index including the POC in the calculation process, the order has changed. If the cruise ports have the high hub index, it is regarded as having more influential power than other cruise ports. Barcelona has the highest value, with 0.188, followed closely by Civitavecchia with 0.182, Palma de Mallorca 0.135, Marseille 0.120, Southampton 0.116 and La Valletta 0.060. Interestingly, Southampton that even though has highIn-Degree, Out-Degree and Betweenness, has taken 5th position.

Hub and Authority Combined Centrality (HACC)
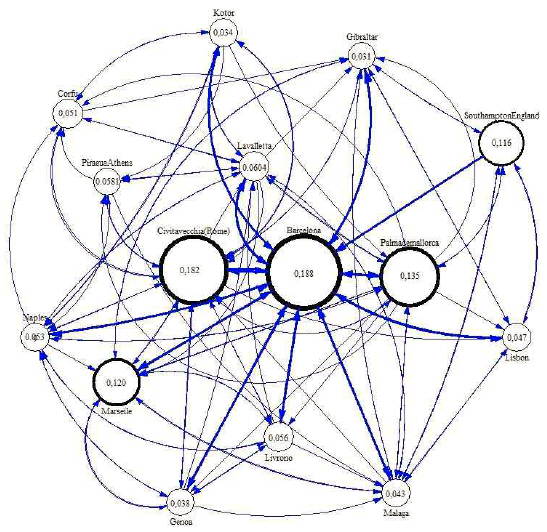
In Fig. 1, it can be seen that the top 3 ports for the Mediterranean ports network in terms of hub index are Barcelona, Civitavecchia and Palma de Mallorca, the thickness of the circles indicates that they have the highest hub index in the area as well as the arrow thickness is the major connections the ports have. Even though the Mediterranean region is divided in 4 different areas, due to the fact that 80% of the activities are centered in the Western Mediterranean area, the network is more centered in them, this doesn’t mean any of the Eastern ports as the Italian ports situated in the Adriatic sea or Piraeus that is in the Eastern part, are not important in the network, but they have less activity related to the cruise in the area.
Top 3 Mediterranean ports network
5. Conclusion
The aims of this study is to find out the networks of Mediterranean and hub ports of it. This paper uses the SNA methodology, which includes Hub and Authority Combined Centrality (HACC) that has been used to analyze the cruise port centrality, as well as the degree centrality such as In-Degree, Out-Degree, and Betweenness. The empirical study was carried out and the results can be summarized as follows.
Firstly, in terms of the degree centrality such as Out-Degree, In-Degree and Betweenness, the first one is Southampton. This is due to its function of nexus between the Mediterranean area and others such as the Caribbean and Asia. The degree centrality just calculates the initiated flow and received flow. Therefore this index cannot check the true influences of cruise ports.
Secondly, we used hubs centrality and authority centrality to identify the links with the influential ports. In case of hubs centrality value, we have as the first one Civitavecchia with a value of 0.262, Southampton as second with a value of 0.246 and Palma de Mallorca as third with a value of 0.232. For authority centrality we have Barcelona as the first one with 0.246, Civitavecchia with 0.218 as the second one and La Valletta as the third one with a value of 0.15.
Thirdly, the hubs centrality and authority centrality do not reflect the number of port calls at the cruise port. In this sense, hub index, which incorporates the number of port calls, is true index, which can measure the influential cruise ports. As a result of analysis, the top 3 ports for the Mediterranean ports’ network in terms of hub index are Barcelona (0.188), Civitavecchia (0.182) and Palma de Mallorca (0.135).
The academic implications are that we suggest the way of the integration of the data based on real itineraries and numbers of POC(Port of Calls), as well as the selection of the hubs of the area. For the practical implications are suggested such as a clear requirement for cruise industry, as a way to widen the scope for the Mediterranean and a reference for the cruise companies to choose the homeports.
From the results of this study, some suggestions can be drawn to develop the cruise industry of Korea. Firstly, for the improvement of the cruise industry, a better connection between the attraction areas and the cruise ports, should be accomplished, passing by the top hub ports. Secondly, the cruise port has to be well-equipped port which obtains the tourist satisfaction through the fine dinning, shopping, culture, and quality leisure. Thirdly the cruise shipping companies have to introduce more various sea activities using high technology such as augmented reality systems, drones, and near field communication (NFC) technology.
There is a research limitation in gathering detailed data in every cruise ports in Mediterranean area. In future research, using the detailed data, the concentration, de-concentration and competition of cruise ports are needed to analyze.
Acknowledgements
This work was supported by Ministry of Oceans and Fisheries (Training of Shipping & Port Logistics Experts) Research Grant in 2020.