Analysis of Harbor Tranquility due to Port Expansion
Article information
Abstract
This study examined the port expansion plan for the fishery port at the east coast of Korea, in accordance with permission conditions for coastal ports such as a limit on the cargo volume and passenger demand for the coastal tourism belt formation. The site was chosen as a municipal coastal port attracting the new ocean industry and building waterfront zone as a hub of new marine tourism. Two different numerical models (Swan and Bouss 2D) were used. Before applying to the target sea area, some numerical tests were conducted for the variation according to Bouss-2D’s strong/weak and nonlinear technique compared to the irregular diffraction of semi-infinite breakwater with a theoretical solution. As a result, there was a difference in strong nonlinearity with breaking waves and it was necessary to experiment with a strong nonlinear analysis technique for the actual site. Two numerical models were applied to the fishery port site and the tranquility of some alternatives were analyzed. The numerical results show the most suitable plan was ALT-1, with satisfied harbor tranquility and reasonable economic sense. The extension of the east breakwater and enlarged turning basin of the F-Land plan have brought generally more stable harbor tranquility than the ALT-1. The result can be used as a reference for the port expansion plan in the future.
1. INTRODUCTION
Recently, with increased number of people enjoying marine leisure activities and coastal landscapes due to the increase of tourism demand, as the income increases. The expansion of sightseeing spots and maintenance of environment on coastal area are necessary. As the coastal ports of the East Coast of Korea are attracting 1.9 million marine tourists annually, the expansion of tourist spots is necessary by extending the fishing port to meet the tourism demand. For Gyeong-ju city, with its own reputation for historical city, the Gampo Port is selected base for ocean tourism, under plan to foster an ocean tourism center, such as expansion of waterfront facilities, and the lighthouse project at Songdaemal, the Gampo-Ulung coastal liner operation are being carried on scheduled with Sadong ferry dock construction. The Gampo is supporting harbor to transport cargo or nuclear supplies to Ulsan or Pohang Port and as a result, Gampo had been trying constantly to switch to coastal port. Gampo Port also contributes greatly to the revitalization of marine culture and tourism, so it is necessary to expand its function as a coastal port through the transport of sea freight and passengers along with fishing and water facilities. The target area Gampo is a national fish port near Gyung-ju city. The freight and cargo estimation from the economic and social feasibility analysis on the assignment and development of coastal ports are shown on Table 1 and 2 (Gyung-ju, 2014).

Predicted domestic cruise tour demands (Unit :1000)

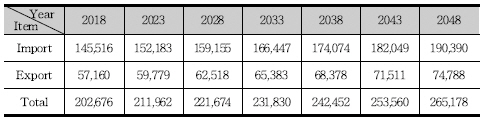
Predicted coastal cargoe at Gampo port (Unit : ton)
According to the third National Port Master plan (MOF, 2016), the minimum passenger required for coastal port designation is 250,000 per year and the required cargoes are 110,000 tons per year. In 2018, Gampo port has handled 300,000 passengers per year and 200,000 tons of cargo. As a result, Gampo has met the criteria for designation of coastal port.
In this study, we conducted numerical tests to develop new ports and secure existing harbor tranquility, and tried to setup numerical models for each development plan, and to derive optimal conditions through experiments on extracted deep water design parameters.
Theoretical value for irregular wave diffraction from Goda (1978) was used to carry out for strong/weak nonlinear numerical analysis (Boussinesq) and wave action balanced equilibrium equation model analysis (SWAN, WAMDI Group, 1988) before applying to actual target sea. The harbor tranquility problem was analyzed with two numerical models in terms of the maximum mooring limit wave height.
2. BASIC EQUATION FOR NUMERICAL MODEL
For prediction of wave climate and limit waves at the given port, it is necessary to apply two numerical models. The First Model based on the wave action balance equation was defined as equation (1). This method has been successfully applied to various wave propagation situations in the context of finite difference model.
where, N is the wave action density spectrum, t is time, cx, cy are representing the spatial propagation speeds, and cσ, cθ are the propagation speeds in terms of frequency and directional domains, σ is the equivalent relative frequency, θ is the wave direction, and
The second model is the Boussinesq wave model. The depth integrated the continuity equation and momentum equation developed by Nwougu(1993) which is applied to shallow water up to the deep water limit h/L = 0.5) but considering steep near breaking waves in shallow water, Nwougu(1996) had modified those in fully nonlinear form as shown here.
where, η is the water surface elevation, uf is the volume flux density of horizontal velocity
The effect of energy dissipation due to a turbulent boundary layer at the seabed has been modeled by adding a bottom shear stress term to the right hand side of the momentum equation uα. Here fw at equation (5) is the wave friction factor. The linear dispersion relation of the Boussnisesq model is given by the phase speed as shown in equation (6) and those parameters were depicted from Nwogu & Demirbilek(2001).
where
3. EVALUATION OF MODEL
In order to verify the applicability of the wave action equilibrium equation model and the Boussinesq equation model, model results were compared with the data from formal diffraction theory by Goda (1978), based from irregular wave a semi-infinite breakwater diffraction experiment. Here the direction spread factor is defined as Smax using the Bretschneider-Mitsuyasu spectrum and the Mitsuyasu direction function. The JONSWAP spectrum were applied on both models, and the geometry and direction distribution coefficients were applied with γ = 3.3, σθ = 10°, respectively, distribution similar to Smax those applied in the Goda’s refraction diagram. Verification of numerical experiment was performed under the conditions of wave height H0 = 1.0m , period T0 = 10sec, depth of 12m, and L=100m for wavelength as shown in Fig. 1. Here, wave direction was perpendicular to breakwater, the coordinate were dimensionless to the wavelength (L). The asterisks on the graph are from Goda's irregular wave theory, the single point lines, solid lines, and dotted lines represent, SWAN, Bouss-2D (strong), and Bouss-2D (weak), respectively.

Comparison of wave height between theory and computations for semi-infinite breakwater both at y/L=2 and y/L=4
The comparison of the graph proved that the strong/weak nonlinear method of the Bouss-2D model give only slight variations, generally showed a tendency to approach Goda's theoretical solution, the applied spectrum and direction coefficient factors for Goda’s diffraction map are generally used in long period waves, with somewhat higher energy transfer than the periods applied in the model, indicating a similar overall trend but somewhat lower response.
4. RESPONSE BY CONDITION FOR BOUSSINESQ MODEL
Due to the nature of the Bouss-2D model, the characteristics of the weak form are limited to the range of 0 < h/L < 0.3 in the deep water. For this range, numerical tests were conducted to examine the response in accordance with two techniques: weak and strong nonlinear conditions.
4.1 Strong non linear condition
For the analysis of the strong nonlinear incident wave condition, the Bouss-2D model is applied to the semi-infinite breakwater under a constant water depth of 20m with a period of 6sec. The wavelength was calculated to be 55 meters with h/L = 0.36. Therefore, the incident waves at the boundary become strong nonlinear condition. Fig. 2 is comparison of wave responses, 2 and 4 wavelength away horizontally (a) and vertically 1 wavelength away vertically (b) from the semi-infinite breakwater under H = 1m, T = 6sec sec with nonbreaking conditions.
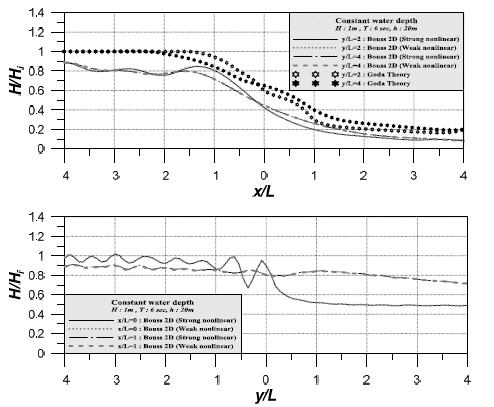
Comparison of wave response at y/L=2, y/L=4 and at x/L=0, x/L=1 (H: 1m, T: 6sec)
Overall, it showed similar trends. However, as Bouss-2D models use 6sec of wave period, direction distribution σθ = 10° for swell and σθ = 30° for wind wave distribution, respectively, the actual response was smaller than that from Goda’s diffraction theory, which contains characteristic of swell.
Next experiment was for incident waves of strong nonlinear property with 3m wave height considering minimum impact from partial standing waves due to the reflected waves from the breakwater. Results showed that higher responses under weak nonlinear condition as shown in Fig. 3. It seemed to have wave attenuation due to a combination of nonlinearity features such as diffraction, breaking, and bottom friction under the strong nonlinear conditions.
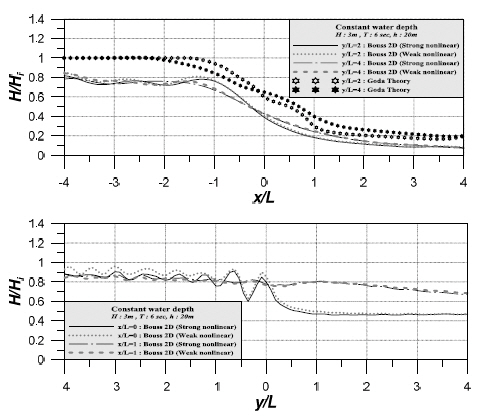
Comparison of wave response at y/L=2, y/L=4 and at x/L=0, x/L=1 (H: 3m, T: 6sec)
Under the weak nonlinear conditions, the nonlinear effects may be underestimated, causing problems in the process of accurately calculating and designing in the harbor, such as the design of breakwater and the analysis of tranquility of harbor. In the incident boundary, the relationship between the water depth and the wavelength was strongly nonlinear, but the nonlinearity of the waves at 1m of wave height was relatively weak, so little difference between the strong nonlinearity and the weak nonlinearity of the waves appeared.
4.2 Weak non linear condition
In order to consider the weak nonlinear waves to the semi-infinite breakwater, 12sec of wave period was applied to a depth of 20m. In this case, the calculated wavelength was 152.3m with h/L = 0.36. Numerical model were constructed with same wave height of 1m to compare between strong and weak conditions for analysis.
Fig. 4 shows each model’s results, with 1m wave height under weak nonlinear conditions and showed no significant difference. With same method used above, as related to Goda’s breaking index, the collected values were h/L = 0.15 where Hb / hb = 0.43 and Hb = 8.6m. To figure out difference between each method including the wave nonlinear property, the numerical experiment was carried out for wave heights of 3m and 7m. Although it confirmed that the effects of the two conditions are different in the previous wave of 3m height and 6 sec period, as shown in Fig. 5, the waves of the weak nonlinear conditions were rather large for the wave of 12sec period. To generate a more significant nonlinear effect, calculation made for the wave height of 7m. As shown in Fig. 6, the result from the weak nonlinear condition also shows high. Although it is a weak nonlinear condition at the incident boundary, the wave height of the extraordinary wave produced a strong nonlinear characteristic of the complex reactions and showed difference depending on the conditions.
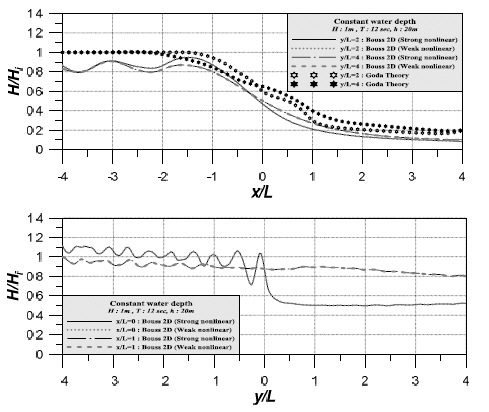
Comparison of wave response at y/L=2, y/L=4 and at x/L=0, x/L=1 (H: 1m, T: 12sec)

Comparison of wave response at y/L=2, y/L=4 and at x/L=0, x/L=1 (H: 3m, T: 12sec)

Comparison of wave response at y/L=2, y/L=4 and at x/L=0, x/L=1 (H: 7m, T: 12sec)
The experiments showed under incidence boundary where weak nonlinear wave with relatively low wave heights, the strong nonlinear evaluation method also can be used, however nonlinear waves which are strong enough to cause wave break, then the result were significantly different. For this circumstance the condition should be treated under strong nonlinear condition. For real cases, there are limitations to apply waves of nonlinear properties, especially waves with short wavelength from deep sea or other extraordinary waves enters the harbor. The wave shows strong nonlinear property, and therefore, carrying out the experiment with strong nonlinear method would be necessary whilst processing numerical experiments such as tranquility analysis for deep water design wave and port operation condition. More discussions on weak & strong nonlinear properties are shown in the previous research(Kwon, 2018).
5. FIELD APPLICATION
5.1 Calculation condition
The goal is to revitalize the local economy by adding passenger and cargo complex functions to the fishing port by expanding the port to the south or the outer part of the existing Gampo port. Currently, ALT-1 was adopted to minimize the limit of ships' entry into the harbor by establishing an outer breakwater to the minimum extent that it does not cause damage of tourist attractions such as Songdaemal lighthouse and cover-uncover rocks in the north, and removing 100 meters of existing southern breakwater in Gampo port. The ALT-2 plan is to create a new cargo ship/passenger ship pier and breakwater in the south where natural beaches currently exist, and is an alternative to planning a new port in the coastal areas of low-lying areas.
To analyze detailed effect, Fig. 7 is map constructed using SWAN model with wide, medium and narrow area are with boundaries of 20 km × 30 km;ΔS = 100 m, 8.5 km × 10 km ; ΔS = 50 m, 2 km × 3.2 km , ΔS = 10 m , respectively. The Approx. H.H.W. is 0.262m. For Bouss-2D model, the boundaries are same as previous model.
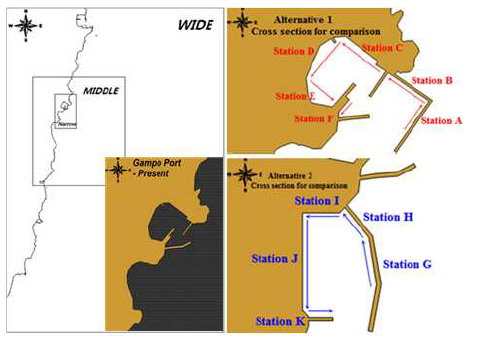
Model area and cross sections for comparison
The locations of deep water design waves are from KIOST (2005) and calculated values are in Table 3a). Fig. 7 show model boundary limit and 11 stations chosen for analysis of detailed wave distribution and other harbor tranquility effects. The limited mooring wave height of 1.1m for cargo ship and 0.7m for fishing boats are used, these were referenced from maximum wave height (only when operation is not effected) from Japan Port Association (1974).

Deepwater design wave height and period
5.2 Result and analysis
The Table 3b) were extracted for SWAN model simulations for wide, intermediate and narrow area with incidence boundary conditions and then applied using Bouss-2D model simulations for detailed results. Fig. 8 is the result in the form of the wave contours from the SWAN and the Bouss-2D models for the E wave, respectively.

Wave height of E wave at ALT- and ALT-2 (SWAN & Bouss-2D)
Fig. 9 and 10 summarize the results of each wave inputs as averaged wave by region. ALT-2 originally planned to develop the southern pier, but all S series of direction except E and NE directions gave higher value than standard limit mooring height at fishery pier on St. G & St. H, at cargo and passenger piers on St. I & St. J, and at an additional southern breakwater on St. K. It has been shown that the wave has not been blocked into the harbor and that the mooring is unstable.

Comparison of averaged wave heights (ALT-1, E ∼ SSE waves)
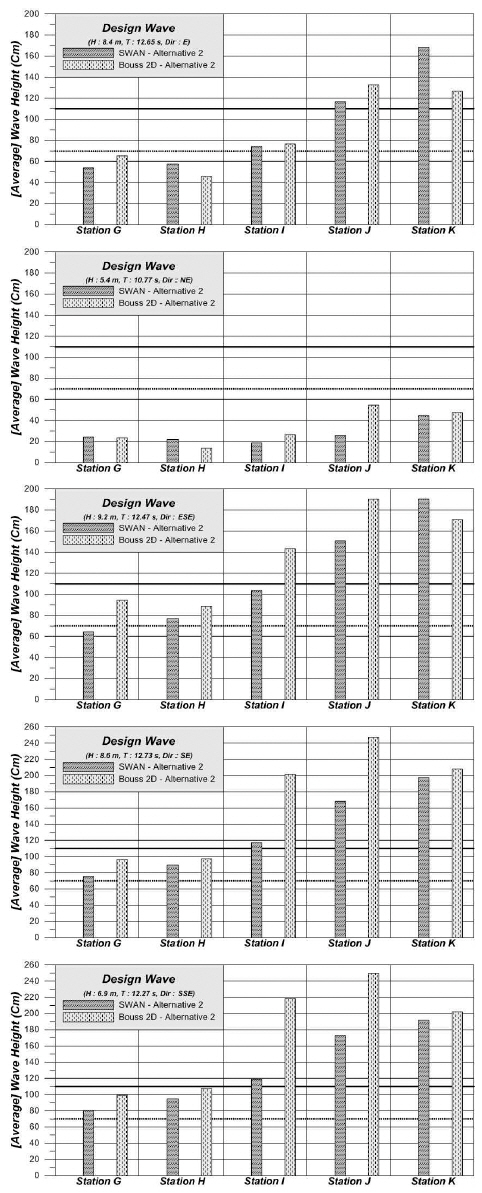
Comparison of averaged wave heights (ALT-2, E ∼ SSE waves)
Therefore, it is believed that the ALT-2 plan is not only suffering from economic problems due to heavy dredging and reclamation in areas with low water depths in front of the southern beach, but does not even secure tranquility.
In the case of ALT-1 plan, when the tranquility evaluation criteria is set to the mooring limit wave height at St. A through St. E, all wave directions maintained stable tranquility, except St. A from S series of wave direction. This tends to result in a slightly higher wave height distribution in St. A. of the additional eastern port, as the diffracted wave energy at the end of the additional eastern breakwater in the S-series of wave is pushed in without dissipating. Additional tests are considered to induce wave attenuation by placing blocks on the outer side of the breakwater or to obtain the tranquility at the east side cargo pier by different shape of the breakwater for S series of wave.
On the other hand, in the S-series, as 100m of the southern breakwater was removed to stabilize the passage of routes, the lack of blocking the entry of waves compared to the present state results in a slight increase in wave height.
The graph confirms that the results of the Bouss-2D model generally show high wave responses and low results in some stations. This is because the Bouss-2D model has the advantage of simulating the diffraction of wave, which is difficult to reproduce in the SWAN model, and can reflect strong nonlinearity in the model's characteristics.
In addition, the diffracted waves from E-series of wave are blocked by the planned west breakwater but those from S-series of wave can penetrate to the lee side of both breakwaters easily. Bouss-2D model reproduces well the diffraction. Therefore, it is deemed necessary to conduct tranquility experiment in the harbor by Bouss-2D models, which reproduce the complex response very well.
5.3 Experimental Study on the Expansion Plan Considering Port Characteristics
Although the investigation was conducted mainly for cargo volume and number of passengers to designate coastal port in the above area, it is necessary to consider priority adjustment such as insufficient mooring facilities and fishing port facilities in consideration of recent changes in the fisheries industry, to reflect the formation of a fishing port exchange plaza.
The artificial island (M-Land) in Oinaoshi port in Japan was completed successfully by linking the space for the storage, auction and sale of fishery products with the breakwater, an outer facility. M-Land has become a landmark of the fishing port area and combined with the local tourism and leisure functions, creating a view and sea fishing area, suggesting the future direction of fishing port development. Fig. 11 shows a successful construction example of manmade Island (M-land), which connects to outer breakwater for reserve purpose, selling and auctions.
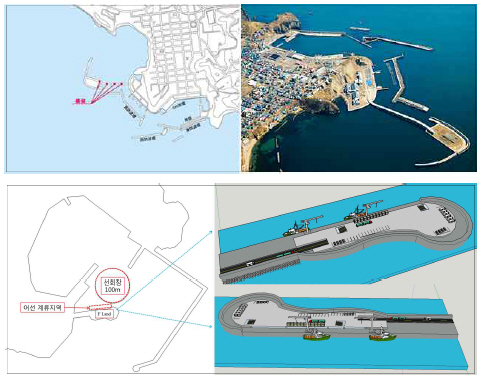
Example of fishery port development at Oinaoshi port of Hokkaido, Japan and suggested F-Land
M-Land became landmark of fishing port, providing fishing and view with other leisure attractions, which gives future idea of harbor. Applying the layout of the ALT-1 derived from the results of the tranquility analysis discussed in the preceding section, but with the layout with the improvement of tranquility and addition of the fishing port and tourism function of the Oinaoshi port, the concept of F-Land (Fish Land of 9,600㎡) was proposed. The plan is to reduce the existing east breakwater by 100 meters to secure the burning basin of fishing boat and extend the head of the eastern breakwater to the inner side for tranquility in the harbor.
Previous method used in ALT-1 was applied to analyze tranquility of F-land. Fig. 12 is wave height distributions from Bouss-2D for the incident of ESE and SE directions, where the earlier results showed relatively higher value than those at St. A and St. B. Extension of breakwater gave lower wave heights and detailed results were interpreted in Fig. 13. ESE direction gave lowered wave heights, but SE direction gave slight increased value at St. C and E. This may be caused by reduction of eastern breakwater to 100m. The analysis of wind effect of F-land gave better tranquility stability than ALT-1. Considering the complex traffic situation of the existing Gampo port, the F-Land can be used as a reference for the future coastal port design project as an alternative that can induce revitalization of the local economy by linking it with the waterfront with the new landmarks, including the expansion of the fishing port, securing the turning basin of fishing boats, and revitalizing the fisheries market.
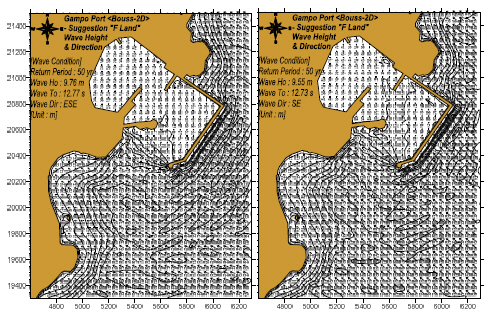
Wave height results according to wave direction
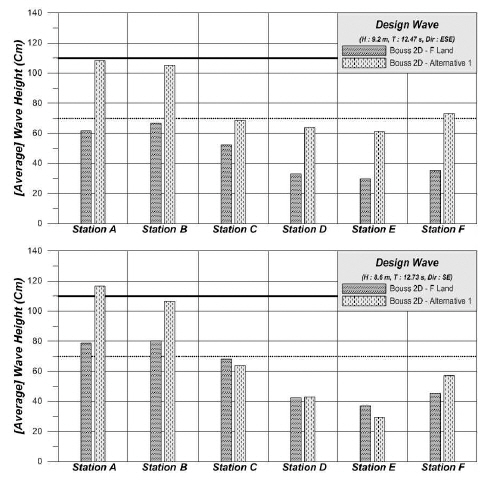
Comparison of averaged wave heights (F-Land, ESE & SE wave)
6. CONCLUSION
This study has examined port expansion plan for a fishery port. Before applying a numerical model to the actual site, different numerical techniques were evaluated with the existing theoretical solution of the semi-infinite breakwater. The strong/weak nonlinear technique is affected by responses in coastal areas and the actual site needs to carry out numerical tests to reflect the strong nonlinearity. Application of models to the field was conducted utilizing the basic data of Gampo port's future port development plan. The numerical experimental results showed the most suitable plan was ALT-1, with satisfied harbor tranquility and reasonable economical sense. The extension of east breakwater and enlarged turning basin of F-Land plan have brought generally more stable harbor tranquility than ALT-1. F-land plan is more attractive because of parking space for visitors and fish storage space for fishermen. Also those results of other proposed plans hopefully could be used for basic data for future harbor expansion.