The Performance Analysis of Container Terminals in Vietnam using DEA-Malmquist
Article information
Abstract
Seaports play a vital role in the economic development of countries, especially for countries having long coastlines such as Vietnam .Seaport industry in Vietnam has witnessed an impressive development in recent years. The national cargo throughput in the period 2013-2017 achieved a compounded annual growth rate (CAGR) of 11.8%/year, higher than that of the world (5.1%). However, the differences in planning policies and infrastructure systems has led to the differences in port performance efficiency of regional ports. Therefore, it is necessary to have a general and accurate view of the picture of Vietnam’s seaport. The objective of this study was to analyze the relative efficiencies of 26 Vietnam container terminals using traditional output-oriented CCR and BCC DEA model. Malmquist Productivity Index (MPI) was also applied to evaluate changes in container terminals productivity over time.
1. Introduction
Shipping plays a crucial role in Vietnam national economy because 90% of nation’s import and export cargo volumes are handle by this factor (Nguyen, 2016). Vietnam seaport system is located along the 1650-kilometers-longcoastline, distributed into three regions-North, Central and South. Vietnam’s seaports are divided into 6 groups according to the ports location. Fig. 1 shows distribution of Vietnam seaport groups according to World Bank (2012). Group 1 is Northern seaports from Quang Ninh to Ninh Binh province, group 2 is Northern Central ports from Thanh Hoa to Ha Tinh. Group 3 includes Central ports from Quang Binh to Quang Ngai, group 4 constitutes Southern Central ports from Binh Dinh to Binh Thuan, group 5 consists of South Eastern ports and group 6 is Mekong Delta ports. In this research, Vietnam container terminal system is divided into 3 regions. These are Northern terminals (includes group 1 and 2), Central terminals (includes group 3 and 4) and Southern terminals (consists of group 5 and 6)
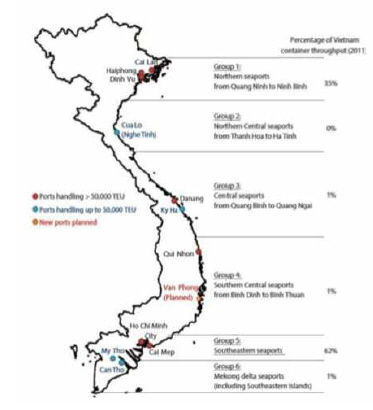
Vietnam seaport map
Source: World Bank
Vietnam’s seaport industry has experienced a significant development in recent years. According to Vietnam Maritime Administration, there are 49 seaports including 219 terminal with 330 berths, 44000 meters of berth and the designated capacity reaches 470-500 million tons annually. The total cargo throughput of Vietnam seaports in 2017 was 270 million tons (including 11.9 million TEUs), 12% higher than that of the previous year (Vietnam Seaport Association). However, the amount of cargoes handled mainly concentrated on Hai Phong city area(Group 1) and Ho Chi Minh city area(Group 5). The Southern seaports are accounting for more than 60% of total cargo throughput and The Northern ones are responsible for about 30%.
In 2008, Vietnam became a member of the World Trade Organization(WTO). During the decade, cargo throughput has steadily increased by 17.3%. However, there are regional differences in development, especially in terms of container cargo. In the north, the major container terminals continues to exceed its capacity while only 50% of the terminal capacity of Southern terminals is used except for Cat Lai. Therefore, it is necessary for a comparative analysis which clarifies the characteristics in operational performance of each region.
This study evaluates the relative efficiency of 26 major container terminals in three different regions named Northern, Central and Southern Vietnam by using Data Envelopment Analysis method. This study also applies the Malmquist Productivity Index to analyze changes in container terminals productivity of selected container terminals as well as productivity changes of each regional groups.
2. Literature Review
2.1 Literature Review on Seaport Efficiency Evaluation Using DEA-Malmquist
The DEA model is commonly used to examine the efficiency of ports and has been the useful tool of many research studies estimating port efficiency. Nonetheless, the limitation of the basic DEA model is only to examine the relative efficiency of objects (Ding et al., 2015). Therefore, Malmquist has been used by many researchers in conjunction with DEA as a solution to overcome this limitation. It helps to estimate efficiency and to evaluate changes in efficiency over time.
Yuen et al. (2013) used DEA-Malmquist models to estimate the efficiency of 21 major container terminals in China and neighbor countries. Barros (2012) evaluated efficiency and productivity efficiency changes in seaports located in Angola, Nigeria and Mozambique from 2004 to 2010 by using DEA an Malmquist Productivity Index. Fu et al. (2009) applied DEA-Malmquist to measure the performance efficiencies of 10 leading container ports in China. Wilmsmeier et al. (2013) used DEA based MPI on a research study on 40 ports in Central and South America. Sanchez and Millan (2012) evaluated efficiencies in 46 Spanish ports.
2.2 Literature Review on Container Terminals in Vietnam
Nguyen and Kim (2015) performed a comparative analysis in order to study the general development of all container terminals in Northern Vietnam from 2005 to 2014. Nguyen et al. (2015) applied Hierarchical cluster analysis to classify all container terminals in Northern Vietnam according to their competitive advantages. Pham et al. (2016) used BCG model to study strategic position of all container terminals in Northern Vietnam. Pham et al. (2016) performed a longitude analysis to evaluate the concentration development of container terminals in Northern Vietnam. Blancas et al. (2014) and Thai (2017) generalized the current operation of Southern Vietnam port system and proposed solutions based on the master plan of government. Dong and Chapman (2006) discussed the environmental factors regarding the development of Southern Vietnam seaport systems.
This study is one of few works on the Vietnamese container terminal but most of previous studies mainly focus on terminals in the particular region as Northern or Southern Vietnam. Moreover, in the field of port efficiency, there are no studies on the Vietnamese container terminal. This research contributed a broader view of the picture of container terminal performance in Vietnam.
3. Methodology
3.1 Data Envelopment Analysis
Data Envelopment Analysis (DEA) is a non-parametric mathematical programming approach for measuring relative efficiencies of decision-making units (DMUs) with respect to multiple inputs and outputs, developed by Charnes et al. (1978). They created the DEA method with constant return to scale (CRS) or the so-called DEA-CCR. This method is extended by Banker et al. (1984) to include variable returns to scale (VRS) and it is also known as DEA-BCC.
Regarding to object of research model, DEA models can be input or output-oriented. The former minimizes the inputs for a given set of outputs, whereas the latter maximized the outputs for a given set of inputs (Kutin et al., 2017). The efficiency score of each type of model is presented mathematically as follow:
Input-oriented DEA-CCR model:
Input-oriented DEA-BCC model:
Output-oriented DEA-CCR model:
Output-oriented DEA-BCC model:
Where ur, υi are weight assigned to output r and input I, respectively. s is quantity of outputs and m is quantity of inputs. xij is amount of input of ith type in jth object, yrj is amount of input of rth type in jth object.
Each DMU selects input and output weights that maximize its efficiency score. Generally, a DMU is considered to be efficient if it obtains a score of 1. In contrast, a DMU is inefficient if its score is less than 1. The CCR efficiency scores measure the overall technical efficiency while the BCC model estimates the pure technical efficiency of a DMU at a given scale of operation.
From obtained CCR and BCC efficiency score, the scale efficiency(SE) can be determined. The scale efficiency is defined as a ratio of DMUs overall technical efficiency score (calculated by CCR model) and pure technical efficiency score (calculated by BCC model). Scale efficiency denotes the degree to which the object is efficient in relation to the optimum using of resources. There are two forms of scale inefficiency: decreasing returns to scale(DRS) and increasing return to scale (IRS). In example, if DMUs are ports, DRS implies that a port is too large to take full advantage of scale. In contrast, if a port experiences IRS it is too small for its scale of operation. A port is scale efficient if it operates at constant return on scale (CRS).
Cullinane et. al. (2005) noted that the output-oriented model provides a more appropriate benchmark for the container industry. In this study, the output-oriented DEA-CCR and DEA-BCC models are applied. The main reasons are port managers prefer maximizing the outputs rather to saving their inputs. In addition, infrastructure inputs such as berth length, draft. number of berth, and container yard size are very costly to reduce.
3.2 Malmquist Productivity Index
Malmquist productivity index(MPI) is the most frequent used approach to quantification of changes in total factor productivity (Baran, J. and Górecka, A., 2015). The Malmquist productivity index was first introduced by Malmquist(1953) and has further been studied and developed by several authors. Färe et al. (1992) developed a DEA-based MPI to measure changes in productivity overtime. This index can be decomposed into two lower components, the first one is the technology change(TECHCH) and the second one is the technical efficiency change(EFCH).
Where: xt and xt + 1 are input factors of DMU at time t and t+1, respectively. yt and yt+1 are corresponding output factors. dt and dt + 1 denote input-oriented distance function with respect to production technology at t or t+1.
M measures the productivity change between periods t and t+1. Productivity declined if M<1, unchanged if M=1 and improved if M>1. The term EFCH denotes the change in technical efficiency between period t and t+1. Technical efficiency change improved if EFCH>1, declined if EFCH<1. The term TECHCH indicates the change in technology frontier between period t and t+1. A value of TECHCH>1 indicates progress in the technology, a value of TECHCH<1 indicates regress in the technology.
4. Empirical Result and Analysis
4.1 Model Construction
The model sample comprises 26 Vietnam container terminals including 13 container terminals which is located in the North, 2 in the Central and others in the South.
North: CICT, Doan Xa, Transvina, Green Port, VIP Green Port, Chua Ve, Tan Vu, Dinh Vu, Hai An, PTSC Dinh Vu, Nam Hai Dinh Vu, Nam Hai, SNP128
Central: Da Nang, Quy Nhon
South: Lotus, Sai Gon, Hiep phuoc Newport, Cat lai, VICT, Ben Nghe, SPCT, CMIT, TCTT, TCIT, Dong Nai.
Golany and Roll(1989) stipulated that the number of DMU should be at least two times the number of outputs and inputs. Boussofiane et al (1991) suggested that the number of DMU should be equal to the multiple of the number of outputs and the number of inputs. However, the most common rule is that the number of DMU is greater than three times the sum of inputs and outputs (Banker et al, 1989).
In this study, the DEA model was designed comprising 2 outputs and 5 inputs.
- Input: Container throughput(thousand TEUs), the number of vessel call(number per year)
- Output: The total berth length(meter), the number of quay cranes, container yard area(thousand m2), the number of industrial parks at port’s hinterland area, the population of port’s hinterland area(person).
Container throughput is the most important and widely accepted indicator for comparing the ports and terminals and also the container is basic handling unit in the operation. In addition, container throughput is the most appropriate and analytically tractable indicator of the effectiveness of the production of a port (Cullinane et al., 2005). While “container throughput” factor closely relates to the need for cargo related facilities and services, “vessel calls” is an index relates to the need for ship related facilities and services (Roll and Hayuth, 1993).
Container terminal operation, on the other hand, depends critically on the efficient use of labor, land and equipment. Thus, the total berth length, container yard area, the number of cranes are very suitable factors to be incorporated into the model as physical input variables. The number of industrial parks and population of port’s hinterland are factors implied the ability to supply goods, labor resource for seaport as well as the ability to consume goods. According to Oliveira’s research, population of port hinterland was considered as an impact factor of port efficiency. (Oliveira and Cariou, 2015)
In this study, the output-oriented CCR-DEA and BCC-DEA models have been applied. Data was collected from websites of port authorities, Vietnam seaport association, and Vietnam government organizations in the period of 5 years from 2013 to 2017.
4.2 DEA Efficiency Analysis
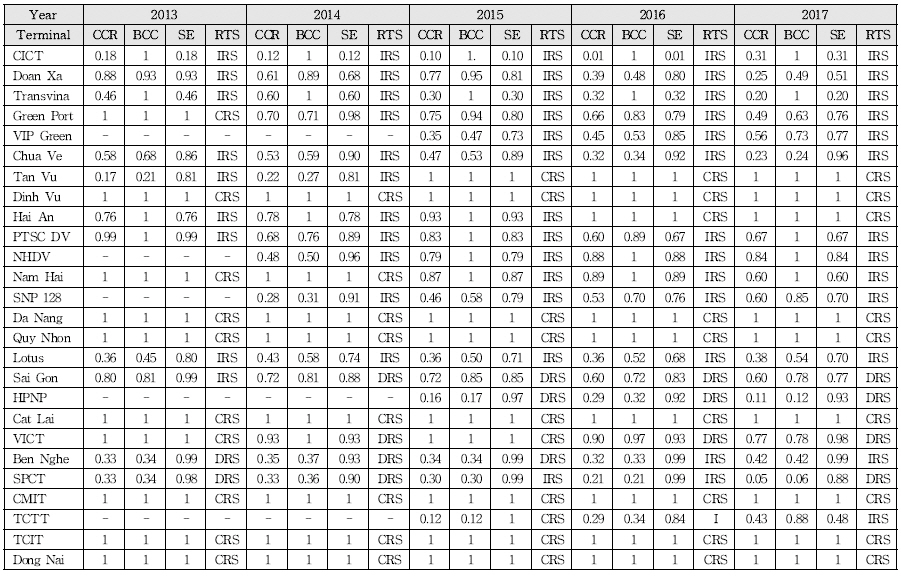
Table 1 indicates the CCR and BCC models which are used to evaluated 26 container terminals. The software DEAP 2.1(Coelli,1996) are employed to derive the solutions to the models.

Efficiency score of each DMU
4.2.1 Northern Region
In the North, the most efficient terminals are Dinh Vu and Tan Vu with efficiency score of both CCR model and BCC model in recent year have obtained value of 1. Tan Vu is the largest container terminal located in Hai Phong, owned by Port of Hai Phong Joint Stock Company (HPH) which is the biggest port operator in Northern Vietnam. Being the newest and largest container terminal of HPH, Tan Vu has great advantages in terms of infrastructure and facility compared to other terminals in the same regions. Started to be put into operation in 2013, Tan Vu was observed low CCR efficiency scores by 0.17 and 0.22 in 2013 and 2014, respectively. However, after from 2015 when Tan Vu was fully exploited, it has obtained effective operation and maintained it until the time of the study. Dinh Vu, which is owned by sub-company of HPH, had been both CCR as well as BCC efficient in 2013-2017. It indicated a reasonable usage of inputs as well as efficient management practises. Chua Ve also is a terminal operated by HPH. Nonetheless, efficiency scores of Chua Ve in both CCR and BCC model was very low and kept dropping gradually during 5 years.
The least efficient terminals are CICT and Transvina. Opened in 2012 and located in Quang Ninh province, CICT is the only one and the largest deep-sea container terminal in Northern Vietnam. It is also the most modern container terminal in the North with 594 meters berth length, 18 hectares CY, 4 modern STS Panamax gantry cranes with loading and unloading capacity of 45 containers/hour/crane(international standard), capable of receiving 4000 TEUs container ship and maximum design capacity reached 1.2 million TEUs/year. Obviously, CICT benefits from inputs but its story is totally different than Tan Vu. The reason is the handling cost of CICT are about 10 USD/container higher than that of competitors in Hai Phong (Nguyen and Kim, 2015). Besides, transport infrastructure and logistics services in Hai Phong are more convenient.
The Bach Dang bridge which was built in 2015, significantly interfered with terminals located at upstream of Cam river(i.e Doan Xa, Transvina, Green Port, Chua Ve, SNP128, Nam Hai). Fig. 2 describes position of Bach Dang brigde and container terminals in Cam river area. The bridge’s static height is 48.4m, ensuring only for ships which are under 20000 DWT to pass. Thus, upstream terminals of Cam river are unable to handle large vessels. Indeed, from 2016, CCR efficiency score of these terminals were quite low, i.e.: in 2017 CCR efficiency score of Doan Xa, Transvina, Green Port, Chua Ve, SNP128 and Nam Hai were 0.25, 0.20, 0.49, 0.23, 0.6, 0.6, respectively. Indeed. results from Table 1 pointed out that 2015 has witnessed the significant drop of efficiency score of these terminals. Terminals located in downstream of Cam river are not affected by Bach Dang bridge, therefore their efficiency score were higher. Young terminals-start operate after 2013, generally, have increased in efficiency scores over time. Particularly, Nam Hai Dinh Vu has the most significant growth, by 0.36% from 2014 to 2017.
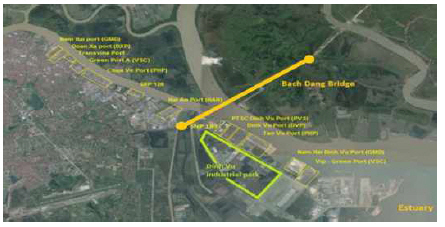
Position of Bach Dang bridge
From 2013 to 2017, in the North most of container terminals were increasing return to scale, only Tan Vu, Dinh Vu and Hai An were constant to scale. This result indicated the fact that container terminal market mainly consists of small and medium terminals with only 1 berth and short berth length.
4.2.2 Central Region
CCR and BCC efficiency scores of both Da Nang and Quy Nhon had obtained value 1. There are not many container terminals in Central provinces of Vietnam. Most of container cargoes in this region are gathered at Da Nang and Quy Nhon city before deliver to ports in North and South Vietnam.. Therefore, competition between terminals in the Central region in terms of container cargoes is quite low.
4.2.3 Southern Region
The most efficient terminals in South Vietnam in the periods of 5 years were Cat Lai, CMIT, TCIT and Dong Nai. CCR and BCC efficiency score of each terminal were 1. Cat Lai, operated by Saigon Newport(SNP)-the biggest port operator in Vietnam, is the biggest and busiest container terminal in Vietnam, which accounted for 71% of total regional container throughput and 33.9% of total national container throughput in 2015. It benefited from its location which is near the downtown of Ho Chi Minh city, industrial parks and warehouses of manufacturing enterprises in the regions. With more than 2000 km2 and 8.5 millions people, Ho Chi Minh city is an important hinterland not only for Cat Lai but also for other terminals in the region. However, other terminals had operated ineffectively. In 2017, CCR efficiency score of Lotus, Saigon, HPNP, Ben Nghe, SPCT, TCTT were 0.38, 0.6, 0.11, 0.42, 0.05, 0.43, respectively. There are some following reasons. Phu My bridge was completed in 2009 that blocking large ships entering terminals located deep inside Saigon river(i.e: VICT, Lotus, Ben Nghe, Sai Gon). Efficiency score of these terminals have decreasing by years as the result of port relocation policy of local authority. Specifically, terminals located deep inside Sai Gon river will be relocated at new appropriate position. Therefore, they have to reduce capacity according to the process.
In Hiep Phuoc area, SPCT and HPNP located along Soai Rap river, are new and state-of-the-arts terminals operated by Dubai World and SNP, respectively but received a very low throughput because Soai Rap river is too shallow and narrow. Efficiency score of these terminals have gradually decreased and achieved very low scores. Be a very new container terminal-commenced operations in 2015, but HPNP, after 3 year of operation, was observed only 0.11 CCR efficiency score in 2017. More miserable, with 0.05 CCR score in 2017, SPCT has became the least efficient terminal in Southern region.
In Ba Ria-Vung Tau area, there are 7 modern deep-sea container terminals: CMIT, TCIT, TCTT, SP-PSA, SITV, SSIT and TCCT. However, only CMIT and TCIT are operating container cargoes, others are currently switched to handle bulk cargo temporarily lead to overcapacity. This over investment is a result of the confident in the growth of economy and the commitment of government to support the development of Cai Mep port complex by constructing necessary infrastructures. During the period 2006-2007, Vietnamese port operators were eager to secure some lots and numerous world-class port operators were rushing to invest in this complex. Among 7 terminals, only CMIT and TCIT are surviving as they have been supported by shipping line partners. CMIT is invested by A.P.Moller Terminal-subsidiary of world biggest shipping line Mearsk and TCIT is invested by SNP and various of shipping lines (MOL, Hanjin and Wanhai).
In 2017, most of container terminals in Ho Chi Minh city as Sai Gon, HPNP, VICT, SPCT had exhibited decreasing return to scale. It indicated demand to scale down terminal and move these terminals out of city downtown.
4.3 Malmquist Production Index Analysis
Table 2 shows Malmquist Productivity Index result calculated by the software DEAP 2.1. The average value of MPI was 1.022, presenting a 2.2% improvement over 2013. There were 14 terminals having MPI value higher than 1 and 7 terminals having value lower than 1. There were 12 terminals have MPI higher than the average MPI value. Tan Vu showed the maximum MPI value in the period 2013-2017, with a value of 1.644. SPCT experienced the worst decline, at a rate of 36.1% over the same period. The mean value of Technical Efficient Change index (EFFCH) was 0.953. There were 5 terminals had EFFCH value greater than 1 and 9 terminals had EFFCH lower than 1. The efficiency improvement of Tan Vu was the most remarkable, increasing by 53.9%. The mean value of Technology Change Index (TECHCH) was 1.072. During this period, most of the terminals’ technology changes achieved high values with the highest one belongs to CMIT(increased 36.5%). Only Lotus had TECHCH value less than 1. The results above prove that productivity efficiency growth were mainly based on an increase in technology changes but not technical efficiency changes.

MPI of each container terminals between 2013-2017
The Fig. 3 below indicated productivity changes of container terminals by regional groups. During the period of study the total productivity change of Central terminals was highest with 4.6 percentage, followed by Northern terminals with mean productivity change of 4.3 percent and Southern container terminals indicated productivity change of 3.3 percent. For the technical efficiency change, Central terminals indicated unchanged score while both Northern and Southern terminals indicated the deterioration with – 3.8% and –4.7%, respectively. However, the mean score of technological change of Central terminals was lowest and that of Southern terminals was leading one. Therefore it is feasible to conclude that Central terminals has operated most effective while even though Southern terminals were invested technology more than their opponents but operated least effective.
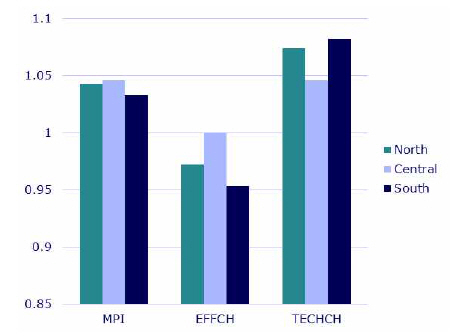
Productivity change by region
5. Conclusion
This research evaluated operational efficiency of major container terminals in Vietnam using CCR and BCC output-oriented DEA model in order to determine the characteristics of container terminal performances of different regions. The analysis results indicated that in the North, there were a significant gap between terminals located upstream and downstream of Cam river because of the construction of Bach Dang bridge. The low height of the bridge made it difficult for large vessel to access terminals located upstream of the Cam river. Younger terminals located downstream of the Cam river has became a better alternative for shipping lines. Most of Northern terminals were increasing to scale.
In the Central region, there are only two biggest container terminals namely Da Nang and Quy Nhon.. Therefore, without competitive pressure on cargo supply these two terminal have maintained their effective performance annually.
In the South, there were also a discrimination between big terminal Cat Lai and other terminals located deep inside Sai Gon river as well as terminals on Soai Rap river. Only Cat Lai were effective while others were increasingly ineffective. In Cai Mep – Thi Vai area, CMIT and TCIT have operated effectively thanks for support from international liners.
Most of Northern terminals were increasing return to scale, whilst decreasing return to scale were current tendency of Southern container terminals. This has reflected the fact that most of container terminals of Northern ports are small terminal and have the potential ability to scale up operations in the future. Whereas, as the consequence of overinvestment in ports of Vietnamese government as well as that of port relocation policy, Southern container terminals have not being operated their capacity well.
This study also applied Malmquist Productivity Index to determine and analyze the productivity changes and its decomposition in selected terminals within their respective regional group in the period 2013-2017. The result indicated that average value of MPI was 1.022. It, in general, presented a 2.2% improvement of all terminals over 2013. The average value of TECHCH was 1.072 and the average value of EFFCH was less than 1. During this period, most of the terminals’ technology changes achieved values greater than 1 but only one terminal had TECHCH value less than 1. The results proved that productivity efficiency growth were mainly based on an increase in technology changes but not technical efficiency change.
In terms of regional groups, the total productivity change of Central terminals were higher compared to the rest of the group, followed by Northern terminals and Southern ones. Similarly, the mean efficiency change of Central terminals were highest and that of Southern terminals were lowest. However, for technology improvement score, Central terminal achieved lowest score while Southern opponents obtained highest score. The result implied that Central terminals has operated most effective while even though Southern terminals were invested technology more than their opponents but operated least effective.