Supramax Bulk Carrier Market Forecasting with Technical Indicators and Neural Networks
Article information
Abstract
Supramax bulk carriers cover a wide range of ocean transportation requirements, from major to minor bulk cargoes. Market forecasting for this segment has posed a challenge to researchers, due to complexity involved, on the demand side of the forecasting model. This paper addresses this issue by using technical indicators as input features, instead of complicated supply-demand variables. Artificial neural networks (ANN), one of the most popular machine-learning tools, were used to replace classical time-series models. Results revealed that ANN outperformed the benchmark binomial logistic regression model, and predicted direction of the spot market with more than 70% accuracy. Results obtained in this paper, can enable chartering desks to make better short-term chartering decisions.
1. Introduction
The freight market is characterized by high volatility; in particular, the increase in volatility since the mid-2000s is considered to be one of the most extreme that has occurred in the history of shipping. Such market volatility naturally translates into ‘market risk’ for shipping companies, as shipping companies are exposed to changes in the freight market and market volatility is one of the most critical factors that affect their financial performance. From a market risk-management perspective, a scientific approach to forecasting is essential and, in this respect, the development of freight rate forecasting models is a key issue in both academic and industrial circles (Celik et al., 2009).
In the field of forecasting, neural networks are gaining attention due to their outperformance over classical time-series forecasting models. This paper applies neural networks to forecasting in the Supramax freight market. The Supramax market was chosen because unlike Capesize or Panamax bulk carriers, Supramax vessels carry a wide range of cargoes, including coal, grain, fertilizer, steel products, forest products, nickel ore, sand, salt and so on. This means that the demand side of the equation is too complicated to construct successful supply-demand models for the Supramax market. Indeed, for this reason, past studies dealt with markets for larger-sized vessels, for which the types of cargoes are fairly limited.
Past research papers mostly attempted to predict the shipping market by analyzing supply and demand variables, macroeconomic variables and/or the freight series of other shipping market segments (Veenstra and Franses, 1997; Kavussanos and Alizadeh, 2002; Alizadeh and Nomikos, 2006; Batchelor, Alizadeh and Visvikis, 2007). However, questions can be raised regarding the selection of their independent variables; whether the chosen variables are representative of all the other variables; and whether the intuitive selection method is appropriate.
This paper used technical indicators instead of supply-demand variables for the forecasting of Supramax freight. Technical variables are widely employed in financial market analysis – for example, research has been conducted using both machine learning models and technical variables to predict stock prices, and its results have been considered powerful enough to be applied to stock trading in the real world (Kara, Acar Boyacioglu and Baykan, 2011; Patel et al., 2015; Shynkevich et al., 2017).
On the other hand, the results of the previous studies can be used as evidence to prove that the weak-form efficient market hypothesis (EMH) is rejected in the financial market. While the weak-form EMH states that future stock prices are random and are not influenced by past events, technical indicators derived from past price movements play a role in making additional profits. Technical analysis is a trading discipline employed to evaluate investments and identify trading opportunities by analyzing statistical trends gathered from trading activity, such as price movement and volume. Past trading activity and price changes can be valuable indicators of the future price movements. The indicators can be referred to as technical indicators (Investopedia, 2018).
Alizadeh and Nomikos (2009) introduced various technical indicators that can be used in freight rate forecasting. Meanwhile, there have been efforts to apply machine-learning models to the prediction of cargo volumes or freights, as well as to freight trading strategies. The results confirmed that the machine-learning models outperform the existing econometric models (Shin et al., 2008, Shin and Jeong, 2011, Yun et al., 2016).
This paper is significant in that it dealt with the rarely-analyzed Supramax freight market and overcame the limitations of classical time-series models by applying the non-linear neural networks model. The notable results obtained from this paper can be used to enhance the decision-making process of chartering desks by providing a scientific foundation to traders.
2. Data and Modelling
2.1 Data
The data series used for the analysis was Supramax 6-TC average rates for 13 years, from August 26, 2005 to August 24, 2018. The number of observations was 671 and the data frequency was weekly.
The technical indicators used in this research were the following 8 indicators derived from freight and vessel price series for the Supramax and Capesize bulk carriers:
2.2 Penalized Logistic Regression
When the dependent variables are categorical, generalized linear regression models cannot be applied. In this research, the dependent variable was categorical, i.e. ‘up’ when the next week’s market movement is positive or ‘down’ when negative. Hence, binomial logistic regression (LR) was used as a benchmark model to compare the performances of the neural networks model. Fig. 1
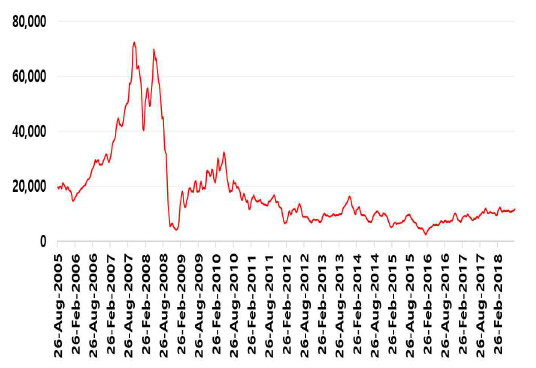
Supramax 6-TC rates

Technical indicators
In the LR, the dependent variable is replaced by the ratio between the probability of having a specific value and that of not having a specific value. This is referred to as ‘odds’.
The odds have a range of positive-only values and are subject to exponential variation. The natural log is applied to the odds to eliminate the above limitations. Eq.(1) is the mathematic expression of the logistic regression.
where pi(yi = 1) in Eq. (1) is defined as eq.(2).
The parameter estimation is done by applying the Maximum Likelihood Estimation (MLE).

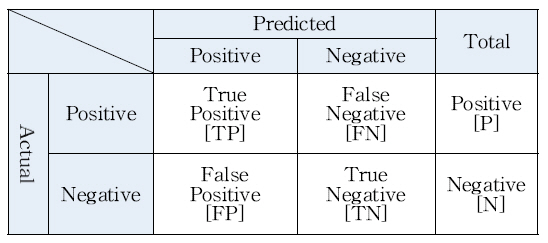
Confusion matrix for binary classification
Eq.(3) is the regression parameter that maximizes the likelihood function. The natural log is taken on both sides and the partial derivatives are taken for β to estimate the parameter. Another problem to be addressed regarding regression is overfitting. Regularization is applied to avoid overfitting. The regularization parameter λ is applied as a penalty in the learning process. In eq.(4), ℓ(β) is the unrestricted log-MLE and F (β) is the penalty function.
λ was estimated using a 10-fold cross validation, and the estimated λ is 3.26 as displayed in Fig. 2.
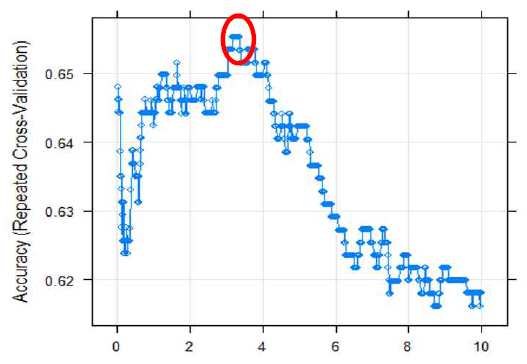
Estimate of λ shrinkage parameter
2.3 Artificial Neural Networks
One of the most popular models in both academia and in practice is artificial neural networks. The model was inspired by the study of human biological neural networks and has a long history of development. Its popularity is quite recent, rising along with the progress made in the explosion of computing power. The model is used in a wide range of research domains and has successfully overcome the limitations of classical linear models while providing a more straightforward interpretation of results.
In eq.(5), w is the weights between nodes, and p and q are the numbers of input-layer nodes and hidden-layer nodes, respectively. The following Fig.3 represents the structure of artificial neural networks.
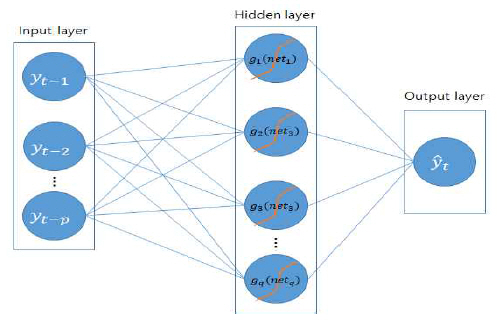
Framework of artificial neural networks( Zhang et al., 1998)
The design of neural network models – i.e. the selection of input variables, the number of hidden layers and nodes, activation functions, and the ratio between training and test samples – affects the performance of the model.
A consensus on the selection criteria, however, has not been reached. Therefore, the performance of the model relies on the availability of the data and the ability of the model designers (Li and Parsons, 1997; Fan et al., 2013). In the case of hidden layers, the literature review by Cybenko (1989) and Zhang et al. (1998) shows that in most cases, one hidden layer is enough to produce satisfactory results.
Referring to their review, this research was performed with a model with one hidden layer. One of the most widely used activation functions, i.e. the logistic function,

Estimated parameters of ANN
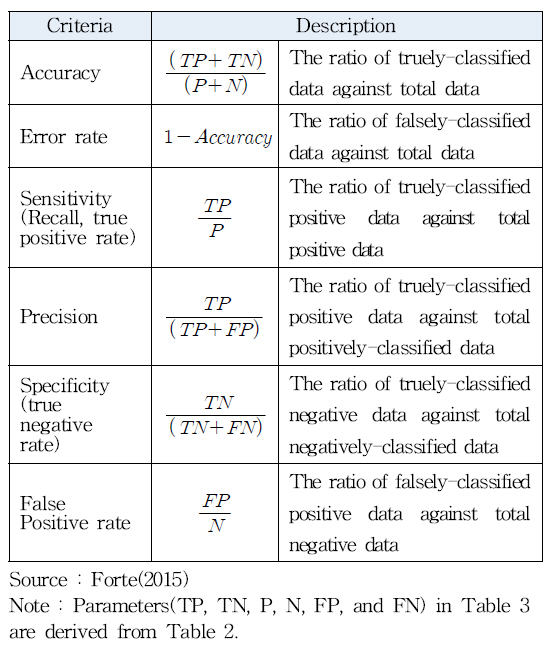
A confusion matrix was formed to compare the performance of the models. The evaluation criteria chosen for the binary classification problems were in Table 3.

Performance criteria from confusion matrix
3. Empirical Results
3.1 Artificial Neural Networks
The actual performance measures on the test data are summarized in Table 4.

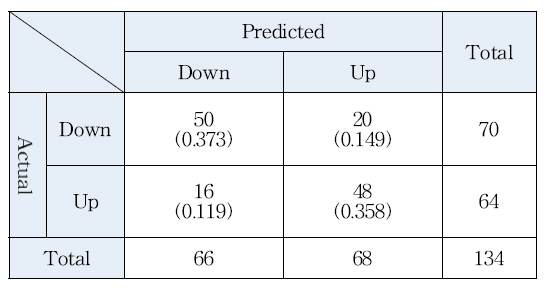
Confusion matrix for ANN
The accuracy rate was 73.1% and the error rate was 26.9%. The truly classified positive weeks of 48 against the actual positive weeks of 64 produced a sensitivity of 75%. The truly-classified negative weeks of 50 against the total negatively-classified weeks of 70 produced a specificity of 71.4%. The precision was 70.5% as the number of truly-classified weeks was 68 while that of the total positively-classified weeks was 48.
3.2 Penalized Logistic Regression
Table 5 shows a confusion matrix of the result of the logistic regression model:

Confusion matrix for PLR
It appears that there are serious limitations to making decisions based on the results of the logistic regression model because the accuracy is just 58.2% and the error rate was 41.8%. The sensitivity, i.e. true positive over actual positive, of 78.1% looks encouraging but attention must be paid to the specificity, i.e. true negative over total negatively-classified, of 40%.
4. Conclusion
The construction of the Supramax market forecasting model is challenging because the segment is related to a wide range of minor bulk trades. This meant that in the past, the segment was disregarded when it came to research.
This research utilized technical indicators, which have been actively used in the field of finance, for the projection of freight in the long-neglected Supramax market. The extraction of information from the freight series was successfully performed with the popular artificial neural networks model. The fact that ANN used indicators generated by the technical analysis as input variables differentiates this paper from previous ones.
While the neural networks model showed a notable performance of 73.1%, the benchmarking logistic regression model demonstrated a doubtful 58.2%. In the case of the artificial neural networks, it is possible to reject the weak-form EMH because the information extracted from the past freight series can be used to make a successful short-term market forecast. The results of the logistic regression model can hardly be used as a basis to reject the hypothesis.
The findings of this research are expected to make a meaningful contribution to the chartering practice by providing a reliable guideline to short-term trading decisions.