

Introduction
Although the world seaborne trade in 2016 recorded an increase in volume of 2.6%, up from 1.8% in 2015, the maritime transport sector still has been confronting the effects of the economic downturn of 2009. Recently, ‚Äúweaker world economic growth, dwindling merchandise trade volumes and rising cost pressures continued to weigh on the performance of world seaports‚ÄĚ (UNCTAD, review of maritime transport 2017). more ever, the trends in the world container ports such as the deployment of mega-ships, the alliances or consolidation of shipping lines are also imposing great pressures on container ports and force them continue improving their level of performance. As a country with over 3,200 km of coastline and 49 seaports (Vinamarine, 2008), Vietnam has not been outside the influenced area of maritime world. Recent years, Vietnam ports have been facing the fierce competition from both domestic ports and international ports, especially when there have been some new and modern ports being constructed in Vietnam such as VIP Green Port or Lach Huyen Port.
To have an insight about the performance efficiency of Vietnamese container ports, this study employs Data Envelopment Analysis (DEA) to evaluate the efficiency of 21 major container ports in Vietnam together with 7 majors container ports of Korea which is known as a strong maritime country with the hope that the results will bring more accurate and interesting information about container ports in Vietnam especially when comparing with Korean ports. In addition, to see how different in level of efficiency among different regions in Vietnam, Vietnamese container ports are divided into 3 groups corresponding to 3 regions in Vietnam, namely the North, the South and the Central and their average efficiency score are compared to each other.
Literature review
Since the first academic journal paper of Roll and Hayuth(1993) which applied DEA to analyze the efficiency of 20 ports, there have been a large number of researches interested in port efficiency using various DEA models or combining DEA with other methods. martinez- Budria (1999) applied DEA-BCC model to analyze efficiency of 26 Spanish ports using panel data from 1993 to 1997 and he chose depreciation cost, labor cost, other expenditures as input factors and cargo throughput, rental income from leasing port facilities as outputs. Tongzon(2001) employed DEA-CCR and DEA-Additive to 16 container ports comprising 4 Australia ports and other 12 international ports. This study selected 6 input factors namely number of cranes, number of berths, number of tugs, terminal area, vessel waiting time and number of port employees and 2 output factors selected are container throughput and the number of container moved per working hour. Furthermore, Cullinane et al.(2005) employed DEA to analyze the relationship between efficiency and organizational structures using panel data from 1992 to 1999 of 30 container ports around the world. Cullinane et al.(2006) applied both DEA and SFA in examining efficiency of 57 ports and terminals of top 30 world’s biggest container ports in 2001 and compared the results obtained. Some other previous studies on DEA and port efficiency are summarized at table 1:
Table 1
Summary of previous study
| Authors (year) | Model | Sample | Inputs | Outputs |
|---|---|---|---|---|
| Itoh (2002) | DEA-CCR DEA-BCC | 8 Japanese port | Container throughput | |
| Ryoo (2005) | DEA-CCR DEA-BCC | 24 Korean container terminals | Container throughput | |
| Ryoo (2006) | DEA-CCR DEA-BCC | 26 container terminals from China, Korea and Singapore | Container throughput | |
| Seoetal (2012) | DEA-CCR | 32 container ports in ASEAN | Container throughput | |
| Bichou (2013) | DEA-CCR DEA-BCC | 420 container terminals | Container throughput | |
| Almawsheki etal(2015) | DEA-CCR | 19 container terminals in Middle Eastern Region | Container throughput |
Research methodology
Data envelopment analysis (DEA) is a method for evaluating relative efficiency of the performances between homogeneous organizations such as business firms, hospitals, government agencies, etc.; such units are called decision making units (DmUs). The level of efficiency is determined by comparison each DmU to the single reference DmU or a convex combination of the DmUs located on the frontier.
One of the advantages of DEA comparing to traditional ratio which is commonly used measure of efficiency that is the former can take into account many outputs and inputs at the same time while the latter only uses single output and input. Another advantage is a specific functional form relating inputs to outputs doesn’t need to be imposed in the model so that we can apply it to multiple production process. Table 2
Table 2
Descriptive statistic of data
3.1 DEA CCR model
CCR model was proposed by Charnes, Cooper and Rhoders(1978) and categorized to input - oriented (CCR-I) and output - oriented (CCR-O) models.
The CCR-I linear programming is:
Where,wo is the efficiency score of the o - th DmU,xij is the amount of input i - th for the j - thDmU, yrj is the amount of output r - th for the j - thDmU,vj is the weight of input i - th, őľr is the weight of output r - th, ŌĶ is an infinitesimal value, mis the number of inputs, s is the number of outputs and n is the number of DmUs being evaluated. Table 3
Table 3
CCR output-oriented, BBC output-oriented and scale efficiency
Equation (1) can be transformed to linear dual problem as:
In which, őĽj is the weight of the entity in the reference set used to evaluate DMUo ,slack variables S r + , S i ‚ąí
The CCR-O linear programming as follows:
DMUo is defined as CCR efficiency (or overall technical efficiency) if,őł ‚ąó = 1 , S r + = 0 S i ‚ąí ‚ąó = 0
3.2 DEA BCC model
BCC input - oriented model and BCC output oriented model introduced by Banker, Charnes and Cooper(1984) are respectively similar to CCR input-oriented model and CCR output oriented model but added an additional constraint that is the sum of Lambdas is equal to 1 as
Decomposition of overall technical efficiency
While the CCR model assumes the constant returns-to-scale production possibility set, the BCC model takes into account the disadvantageous conditions of scale under which the DmUs are operating. Then, the relationship between CCR scores (Overall Technical efficiency) and BCC scores (Pure technical efficiency) as follows:
Overall Technical efficiency (OTE) = Pure technical efficiency (PTE) * Scale efficiency (SE)
Decomposing PTE and SE to OTE can reveal whether the source of inefficiency is caused by inefficient operation or by disadvantageous conditions or by both. DmUs obtain SE scores of 1 means they are operating at the most productive scale.
Data explanation
DmUs selected include 7 Korean container ports and 21 Vietnamese container ports. In which, Vietnam container ports comprise ports from three different regions; they are from the South, the Central and the North. Although it is better to analyze each container terminal in a port, this study treats the whole container port rather than a terminal as a DmU due to limitations in collecting data.
Banker et al.(1989) suggested the sample size should follow as (4), that is, if number of DmUs is,number of inputs is and number of outputs is ,then:
Input factors chose in this paper as proxy of capital, land and labors are container berth length (m), container yard area (m2) and number of ship-to-shore cranes. Container cargo throughput volume (TEUs) is used as the only output factor. Data collected is in 2016 through port’s websites, Google Earth, related Organizations websites such as VPA (Vietnam Seaports Association), KOSIS (Korean statistical Information Service) and directly contacting by phone. The data is statistically described as follows:
Among several types of DEA models, the constant return to scale base output oriented (CCR-O) and variables return to scale base output oriented (BCC-O) are selected to analysis container port efficiency in this study due to the fact that it is not practical to reduce the berth length and equipment quantity. Although port authorities can transfer equipment between ports, it is also really hard and need the collaboration between port operators because of the variety of port authorities. Furthermore, this paper attempt to set a reference target output for the operators of inefficient ports.
Results and discussion
DEA-Solver software providing by Cooper, W.W., Seiford, L.m. and Tone, K. (2006) was employed to analyze the efficiency of 28 DmUs, results as follows:
5.1 Overall technical efficiency, pure technical efficiency and scale efficiency
As showed in the results obtained from CCR-O model, there are only 3 efficient container ports, namely Busan New Port (Korea), Cat Lai-SGNP (Southern Vietnam) and Dinh Vu New Port (Northern Vietnam). While Gunsan (0.15) and Pohang (0.24) are the two most inefficient container ports in Korea, Bong Sen (0.11), Ben Nghe (0.12) and TCTT (0.17) are the three most inefficient container ports in Vietnam and they are all in Southern Vietnam.
There are some container ports with the relative large production size but performed the relative low efficiency such as Hai Phong (0.34; 1,086,630 TEUs) and Gwangyang (0.52; 2,249,585 TEUs). Then, the relationship between the efficiency and the size of production (represented by the cargo volume) was tested by using Spearman’s rank order correlation coefficient. However, the coefficients obtained are 0.7037 and 0.3594 for CCR model and BCC model, respectively. The coefficient for CCR model demonstrated that the size of production is significantly impacts the efficiency of container ports and when the influence of operating scale score is eliminated in BCC efficiency score, the coefficient is much smaller, means the size of production is no longer significantly effects to the efficiency of ports. This result strongly support for economies of scale concept.
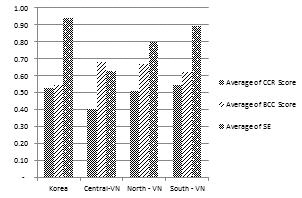
When Vietnamese and Korean container ports are compared, the results indicate that on average, overall technical efficiency score (CCR result) of Vietnamese container ports (0.52) and Korean container ports (0.53) are similar but, as showed in the BCC model results, the pure technical efficiency of Vietnamese container ports (0.65) appear to be more efficient than Korean container ports (0.55). This difference can be explained by the difference in scale efficiency score of Korean container ports and Vietnamese container ports. While all Korean container ports in this analysis are operating at nearly optimal scale (average SE= 0.94), Vietnamese container ports are indicated that their overall technical efficiency are influenced by the improper scale (average SE =0.83).
In the BCC results, the number of efficient DmUs substantially increases to eight ports, there are five more efficient container ports, namely Transvina (CCR: 0.24, BCC: 1), Nghe Tinh (CCR: 0.44, BCC: 1), Binh Duong (CCR: 0.82, BCC: 1), VICT (CCR: 0.83, BCC: 1) and Dong Nai (CCR: 0.9, BCC: 1). Transvina (SE: 0.24) and Nghe Tinh (SE: 0.44) are two container ports affected the most by scale of economic.
Among three groups of Vietnamese container ports, the group of container ports in Central - VN is the most technical inefficiency group (CCR: 0.4) and also being affected the most by scale (SE: 0.63). This may due to the Central of Vietnam is the least developed economic region among above three regions and container ports in this region function as transitional ports.Fig 1
5.2 Return to scale
As described in table 4, majority of Vietnamese container ports is operating under increasing return-to-scale (81%) which means that the output is increasing at the larger proportion than the input increases. However, as matías Herrera Dappe and Ancor Suárez-Alemán(2016), ports are limited in their ability to affect the demand that means we cannot increase significantly inputs in the hope that ports can increase output proportionally. In addition to that, there are many other factors need to examine such as available land, capacity of hinterland connectivity, congestion of existing facilities, etc. that the policy makers should thoughtfully consider before influencing the scale of operation.
5.3 Projection and slacks
The projection results indicate that majority of inefficient container ports are mix-inefficiency, means they should increase their outputs to the projection and also reduce slacks in the inputs at the same time. For instance, Gwangyang port needs to increase cargo throughput 102% more and reduce slacks of 725 meters in container berth length, 1,289,000 square meters in container yard area and 3.21 number of crane to be efficiency. There are only very few container ports are radial inefficient, namely Dong Nai, TCIT, Hai Phong and Doan Xa (all slacks are zero). Table 5
Table 5
CCR projection of inefficient container ports and their slacks
On average, Korea container ports need to increase 221% output, North-VN container ports need to increase 190% output, Central-VN container ports need to increase 168% output and South-VN container ports need to increase 246% output together with reducing slacks to achieved level of efficiency.
Conclusion
This paper evaluates the efficiency of 21 major container ports in three regions in Vietnam together with some major container ports in Korea. The results point out that on average, the overall technical efficiency of Korea container ports is similar to Vietnamese container ports. However, after decomposing the inefficiency into component parts, the results indicate that while Korean container ports are operating at nearly optimal scale and their inefficiency is caused substantially by managerial inefficiency, the inefficiency of Vietnam container ports is caused not only by managerial inefficiency but also by the disadvantageous conditions of scale.
Among three different region groups of container ports in Vietnam, container ports in the Central of Vietnam are the most technical inefficient group and being influenced the most by operating scale. Besides that, this study addresses that majority of Vietnamese container ports is operating under increasing return-to scale. This conclusion is consistent with Nguyen et al.(2017) which analyzed 43 Vietnamese ports handling various types of cargo (container, general cargo or bulk cargo) even though this study only focuses on container ports and there are some major Korean container ports selected to evaluate the efficiency together with Vietnamese container ports. However, in this paper, there are some different conclusions with Nguyen et al.(2017) when the container ports are analyzed separately and in more detail. As the results indicated from this study, container ports in Southern Vietnam are slightly more efficient than in the North because of their advantage in operating scale whereas container ports in the North appear to be more efficient than in the South in term of pure technical efficiency, while Nguyen et al.(2017) justified that ports in the North including container ports are more efficient than in the South. From these results, the study implies that in applying DEA to analyze efficiency, different types of ports should be analyzed separately to have more accurate results so that port authorizes can identify which part of their port (container terminals, bulk cargo terminals or specialized cargo terminal) performs inefficiently.
In the meantime this research has some limitations in the selection of DmUs as well as input and output factors. Some DmUs in Vietnam consist of ports and container terminals. It is better to compare the same status of DmUs. This research considered input factors such as container berth length, yard areas, number of crane and output factor of container throughput. In the future research it is necessary to consider various input and output factors.
 PDF Links
 PubReader
 Full text via DOI
 Download Citation
 Print
Print


