Efficiency Analysis for Major Ports in Korea and China using Boston Consulting Group and Data Envelopment Analysis Model
Article information
Abstract
Planning strategies to achieve higher competitiveness of ports are becoming increasingly important in business environment. Therefore, strategic competitive position and efficiency analysis needs to be performed to increase ports’ effectiveness and competitiveness. This matches with one of targets of new concept e-Navigation to increase the agility and efficiency of ports. The purpose of this study was to apply Boston Consulting Group matrix to analyze competitive positioning of major ports in Korea and China in term of several main cargo types and then use a combination of Data Envelopment Analysis and Principal Component Analysis model to calculate efficiencies. Results show that, at the moment, Chinese ports are still on the top with high position and efficiency score for the representative-Shanghai port. However, result also points out that except container type, Korean ports have chance to compete in other cargo types. Moreover, Gwangyang port is regarded as efficient. It has better position time. It is believed that Gwangyang port together with Busan port can compete with Chinese port in the near future.
1. Introduction
Since more than 90 percent of the world trade volume is carried by ships, maritime transport is thus an efficiency facilitator of the world and maritime transport was, and currently is, the backbone of development for many countries. A port is the nerve center of foreign trade of a country and the compulsory transit point of cargoes, permitting the import of goods, which the country cannot itself produce in sufficient quantity, and the export of items contributing to the development of its economy. Besides, a port is also a place for the provision of further services, which add value to the products transported and thus helps the increasing demand of trade. Port activities, therefore, perform a strategic role in the international trade.
One distinctive feature of port industry today is that the competition between ports has become much more intensive than ever before. Previously, port markets play a monopolistic role as a result of its exclusive and irreplaceable geographical location. However, in recent years, market structure has drastically changed due to the fast growth of intermodal and international transportation, resulting in port markets facing intense competition. The monopolistic nature of many ports become virtually non-existent and traditionally dominant ports are forced to compete regionally and globally due to the strong economic developments since the early 80’s and a shift in the global center of manufacturing to Asia. In recent times, the North East Asian region has globally large container ports where traffic volume is concentrated and generated the most in the world. These ports are situated in strategic geographical positions for international shipping routes and influenced by business penetration of global shipping lines. In order to improve port’s competitiveness, port operators need to plan proper strategies and be able to identify their current competitive position as well as operational efficiency.
This study focuses on finding the strategic competitive positions of the major ports of Korea and China during the research time from 2013 to 2016 in term of several key cargo types such as container, dry bulk, liquid bulk and ro-ro. Next the efficiency analysis will be carried out to evaluate the current performance of these ports in the market.
many research have studied about competitive position of port (Han(2002), Park(2003), Pham(2016), Dang(2017)). However, most of these studies focused on the competition in term of container ports or containerized cargo and lacked of other cargo types which can also have huge influence to port’s business. In addition, there are so many factors affect to efficiency of a port that using one single model sometime cannot handle or evaluate the result exactly (Adle and Berechman(2010), Adler and Yazhemsky(2010), Chen et, al.(2016)). Therefore, this study aims to analyze the strategic competitive position of the major Korean and Chinese ports by using BCG matrix with dynamic portfolio analysis based on data concerning the actual throughput of the selected ports in order to make quantitative comparison in regard to port’s growth rates and market shares. moreover, in order to evaluate operational efficiency, the combination of PCA (Principal Component Analysis) and DEA (Data Envelopment Analysis) model will be chosen.
The rest of the paper is organized as follows. The reviews of previous studies are described in section 2. Used methodologies are discussed in detail in section 3. Section 4 contains the practical application of BCG matrix for competitive positioning and PCA-DEA model for measuring port efficiency. Finally, the paper ends with some conclusion remarks. Based on the results obtained from the model, it is necessary to focus on the reasons for such inefficiency and even some proposals or suggestions that can be made through this study to further promote the performance of ports.
2. Literature Review
2.1 Research on competitive positioning
The intense competition among ports may be placed within the context of globalization and the international economy that ports need to restructure their operations and management in order to increase their competitiveness as well as their market share. The determinants of competition would differ from levels. Labor, capital, technology, and energy are addressed as competitive factors in port undertaking competition. On the other hand, competition between ports, port clusters, and port ranges is influenced by regional factors, named geographical location, infrastructure, industrialization, government policy, and hinterland (Pham, 2016). Hence, in order to apply strategies for retaining or enhancing the competitiveness of a port, port authorities need to understand their current competitive position and the factors that influence their business environment[5]. Although there have been a number of methods deployed to measure and identify the competitive position of ports, the BCG matrix seems to be more preferred than others. Han(2002) applied the BCG matrix and Total Shift analysis on 21 container ports situated in Asia to determine the dynamic shift of these ports’ competitive positions during 20 years. Park(2006) also showed the trend of competitive positioning of 26 Korean ports in 1994, 1999, and 2003 by using BCG matrix combining with DEA model with main policy implication is to emphasize that the BCG matrix method can give seaport managers the basic information for planning future port management. Or as Pham(2016) used BCG matrix to measure the strategic positioning of Container terminals in Northern Vietnam with the result demonstrate that the Hai Phong terminal dominates the market, but the Nam Hai Dinh Vu and Dinh Vu terminals are considered as “star” performers. Quang Ninh, Doan Xa, and Transvina are losing their competitive positions in Northern Vietnam. And the newest research paper of Dang and Yeo(2017) focused on Southeast Asia region revealed effective operations at the following ports that retained their dominant positions during the duration of the study: Port Klang, Tanjung Pelepas (malaysia), manila (the Philippines), Laem Chabang (Thailand), and Tan Cang Sai Gon (Vietnam). However, most of the previous research papers were only focused on only containerized cargo which is not enough to present the position of a port in the market. And there no comparison between two country such as China and Korea done in the literature.
2.2 Research on port efficiency using PCA-DEA model
many applications of the Data Envelopment Analysis (DEA) can be found in literature. This method has been used in several contexts including education systems, health care units, agricultural production, and military logistics. There are some advantages of the DEA non-parametric approaches when performing efficiency analysis as compared to other methods. Non-parametric approaches are suitable for measuring efficiency of observations with multiple inputs and outputs. It is also not necessary to pre-define the functional relationship between variables. This means that there is no need to impose a specific cost or production function in non-parametric approaches or assume a functional form. This makes DEA approaches particularly attractive for port efficiency studies. many applications of the DEA can be found in literature. However, the biggest disadvantage of this model is the desision making unit (DmU)’s sample need to big enough in compare with the total number of input-output variables. In port area, the number of factors influencing the efficiency and performance are usually big that it is difficult for researchers to select and hard to evaluate the effects of all the factors by using DEA. To overcome these problems, it is useful to implement principal component analysis (PCA). The PCA makes it possible to solve simultaneously two problems: 1) The principal components are less dependent from measurement errors (statistical noise) of real-life data, and 2) using PCA reduces the dimensionality or the number of variables in a DEA structure. Therefore, Adler and Berechman(2001) developed a methodology based on PCA to reduce the number of input(output) variables used in DEA into factors and applied to measure West-European aiport quality form the airlines’ viewpoint. Besides, Adler and Yazhemsky(2010) also researched about apply monte Carlo simulation to generalize and compare two discrimination improving methods and pointed out that PCA–DEA provides a more powerful tool than VR with consistently more accurate results. PCA–DEA is applied to all basic DEA models and guidelines for its application are presented in order to minimize misclassification and prove particularly useful when analyzing relatively small data sets, removing the need for additional preference information. Chen(2016) also use a principal component analysis-data envelopment analysis (PCA-DEA) integrated model to evaluate the operational efficiency of iron ore logistics at the ports of Bohai Bay, China and asserted that the PCA-DEA model provides a practical and powerful tool for the investigation of the port logistics problem. This paper will also apply the combination of two models to measure and evaluate the operational efficiency of ports, focusing on containerized cargo.
3. methodology
3.1 BCG matrix
It is based on the observation that a company’s business units can be classified into four categories based on combinations of market growth and market share relative to the largest competitor, hence the name “growth-share” matrix. market growth serves as a proxy for industry attractiveness, and relative market share serves as a proxy for competitive advantage. The growth-share matrix thus maps the business unit positions within these two important determinants of profitability. The matrix is divided into 4 quadrants Cash Cows (high market share but low growth rate), Stars (high market share and growth rate), Question marks (low market share and high growth rate) and Dogs (low market share and growth rate).
The BCG matrix (so called as growth-share matrix) was originally created by Bruce D. Henderson for the Boston Consulting Group in 1968 to help with long term strategic planning, to help a business consider growth opportunities by reviewing its portfolio of products to decide where to invest, to discontinue or develop products.
3.2 Principal Component Analysis (PCA) model
Principal component analysis (PCA) is a mathematical procedure that transforms a number of (possibly) correlated variables into a (smaller) number of uncorrelated variables called principal components.
The main steps of PCA model:
(1) Calculate the contribution rate of each component to determine how many principal components should be considered.
(2) Compute the principal scores.
(3) In order to interpret each component, should compute the correlations between the original data for each variable and each principal component.
(4) For the analysis of the principal components, the relatively important indicators for the efficiency evaluation of Korea and China ports are selected. These indicators are the input and output indicators to be used in the DEA model.
3.3. Data Envelopment Analysis (DEA) model
Here we give a brief introduction of the model. more formally, let’s assume that there are n DmUs to be evaluated. Each DmU consumes varying amounts of m different inputs to produce s different outputs. Specifically, DmUj consumes amounts Xj=[xij] of inputs (i=1,….,m) and produces amounts Yj=[yrj] of outputs (r=1,…,s). The sxn matrix of output measures is denoted by Y, and the mxn matrix of input measures is denoted by X. Also, let’s assume that xij>0 and yrj>0. Consider the problem of evaluating the relative efficiency for anyone of the n DmUs, which will be identified as DmU0. Relative efficiency for DmU0 is calculated by maximizing a weighted sum of a target output, subject to the constraint that a weighted sum of target input equals unity and the differences of a weighted sum of outputs and a weighted sum of inputs are less than zero. Symbolically:
DEA input oriented CCR dual model:
where ur, vi are weight assigned to output r and input i, respectively.
Definition 1 (Efficiency) DmU0 is CCR-efficient if θ*=1 and there exists at least one optimal (ur *,vi *) with ur *>0 and vi *>0 are optimal solution of (1). Otherwise, DmU0 is CCR-inefficient
DEA input oriented BCC dual model:
Definition 2 If DmU has CCR efficient then it also has BCC efficient.
All variables in (2) are also constrained to be non negative - except for u0, which may be positive, negative, or zero. In order to identify RTS, if efficiency score of DEA-CCR equals DEA-BCC, that means return to scale is constant.
many studies have decomposed the technical efficiency scores obtained from a CRS DEA into two components, one due to scale inefficiency and one due to "pure" technical inefficiency. This may be done by conducting both a CRS (DEA-CCR model) and a VRS (DEA-BCC model) upon the same data. If there is a difference in the two technical efficiency scores for a particular DmU, then this indicates that the DmU has scale inefficiency, and that the scale inefficiency can be calculated from the difference between the DEA-CCR efficiency score and the DEA-BCC efficiency score.
Scale efficiency (SE) = Technical efficiency (TE)/ Pure technical efficiency (PTE)
SE = CCR-TE/ BCC-PTE
4. Efficiency Analysis between major Ports in Korea and China
4.1 Strategic competitive positioning analysis
Data used for this study were collected from reliable sources such as the annual reports of the ports and websites of port authorities. Container, Dry Bulk, Liquid Bulk and Ro-ro cargo traffic are the focus of this study, which mainly influenced port selection for analysis. The research period is from 2013 to 2016 (4 years). In accordance with the above criteria, 13 main ports from the Northeast Asia countries selected for this study, including eight Chinese ports and five Korean ports.
Different types of analysis may be deployed to assess the level of seaport performance in terms of its maritime traffic volume. This study is based on the Product Portfolio Analysis methodology based on the value added for different traffic categories.
The portfolio analysis compares and contrasts the positioning of seaports within the range for each traffic category. Thus, the seaport positioning results from each market share category making up the range and its respective rate of growth.
4.1.1 Container traffic
In term of container traffic, the results described in fig 1 show that the dominant container ports including Shanghai, Shenzhen, Ningbo-Zhoushan, Busan, Qingdao and Guangzhou are now standing on strategic position. During four years, while Shanghai, Shenzhen, Ningbo-Zhoushan and Busan have maintained their sustainable position, while the two ports Qingdao and Guangzhou have fierce competition in terms of market share with temporary win belonging to Guangzhou with higher ranks in the world market. The other Chinese ports (Tianjin, Dalian and Xiamen) experienced in a same situation that are located in the unfavorable position. On the other hand, the remaining four Korean ports show strong growth in the last two years, especially Incheon port with 12.62% of growth rate. It shows that the prospects for future container development in Korea are increasingly focused.
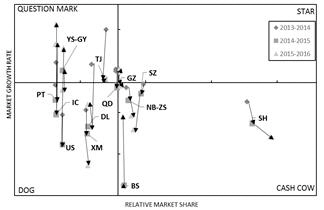
Portfolio of chinese and korean ports-container traffic(2013-2016)
4.1.2 Dry bulk traffic
Due to the lack of information, there are only nine ports including four Chinese (Shanghai, Ningbo-Zhoushan, Tianjin, Dalian) and five Korean ports chosen for analysis. The results are shown in the fig 2.
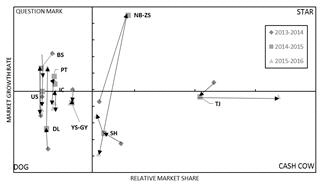
Portfolio of chinese and korean ports-dry bulk traffic (2013-2016)
In term of dry bulk cargo, Tianjin port has become the leader during four research years, followed by two others Shanghai and Ningbo-Zhoushan. Although not to be the leading port but with its market share, Shanghai port has been in the Cash Cow position in four years, meanwhile Tianjin and Ningbo-Zhoushan need to compete fiercely to reach this position. The remaining Chinese port-Dalian has both low initial growth rate and market share; however, there are signs of growth changing position from Dog to Question mark over time. meanwhile all Korean ports show the decreasing trend both in growth rate and market share.
4.1.3 Liquid bulk traffic
Due to the lack of information, there are only nine ports including four Chinese (Shanghai, Ningbo-Zhoushan, Tianjin, Dalian) and five Korean ports chosen for analysis. The results are shown in the fig 3.
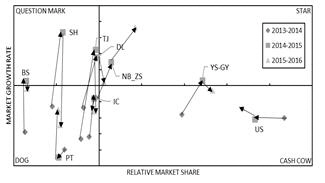
Portfolio of chinese and korean ports-liquid bulk traffic (2013-2016)
In term of Liquid Bulk traffic, the situation has completely changed with the leading ports belong to Korea. With a solid lead, in the past four years Ulsan and Yeosu-Gwangyang ports have always been in the Cash Cow part. Due to the fact that Ulsan port authority focused on liquid cargo handling, the port now is the largest liquid cargo handling port in the Northeast Asia. Two Chinese ports Ning-Zhoushan and Dalian in recent years are leading in terms of growth rate and the increase of market share, which placed them in the Star performer position. Except Pyeongtaek Port increased the market growth during the time, the others experienced the same decrease situation.
4.1.4 Ro-Ro traffic
Due to the lack of information, there are only seven ports including four Chinese (Shanghai, Tianjin, Guangzhou, Dalian) and three Korean ports (Yeosu-Gwangyang, Pyeongtaek, Ulsan) chosen for analysis. The results are shown in the fig 4.
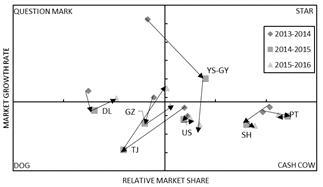
Portfolio of chinese and korean ports – Ro-ro traffic (2013-2016)
In term of Ro-ro cargo traffic, the port of Korea once again in the leading position with the port of Pyeongtaek. The ports experienced variable and large change in term of growth rate. While Pyeongtaek, Shanghai and Ulsan ports stably increase over time, Yeosu-Gwangyang port had significant growth steps even in market share changing position from Question mark to Star and finally to Cash Cow that accurately follows the theoretical development of the success sequence.
4.2 Port efficiency Analysis
After comparing the position of the ports on the market based on the output of the ports, let us go on measuring the efficiency of each port's current performance to see whether the port is moving in a positive way or not as well as find out the cause behind that inefficiency. many factors influence the operational efficiency of the ports. Typical factors include the physical infrastructure of the port, financial factors as well as output factors. The physical infrastructure are the preconditions for the operation of the port. The financial factors point out the efficiency of a port investing in its operating while the output factors show the performance of the port. The factors that have an impact on the efficiency are considered. The input and output attributes of the indicators are taken into account to determine the operational efficiency of Korean and Chinese ports.(Table 1)

Evaluation system for the indicators
As indicated in the analysis presented earlier, the number of input and output indicators should be reasonable when the DEA model is used for evaluation. Given that the original data contain overlapping information, the accuracy of the analytical result will be affected. First, PCA was conducted to convert the original data into a number of independent indicators to protect most of the information in the original data. Korean Shipping and Port integrated data center, Chinese ports’ annual reports and port main websites are the sources of the original data for the evaluation of the operational efficiency of major ports in Korea and China in the year of 2016. Using the SPSS for PCA model and mAXDEA for DEA model to calculate the results.
The correlation coefficients of indicator and the data are analyzed using SPSS. The matrices of the correlation coefficients of the input and output indicators are real symmetric matrices (Tables 2 and 3).

Matrix of the correlation coefficients of the input indicators (correlation matrix)

Matrix of the correlation coefficients of the output indicators
A large correlation coefficient indicates a strong correlation among the variables. Thus, more overlapping information will be obtained. Tables 2 and 3 show a number of overlapped indicator data. According to the correlation coefficient in Tables 2 and 3, some variables have strong correlation. For example, X3 has strong correlation with X6 and X7 with the correlation of 0.78 and 0.62, respectively; X4 has strong correlation with X6 with 0.52 and X6 with X7 (0.9). Furthermore, all of the output variables have strong correlation with each other. In order to reduce the information interference between these variables, it is necessary to extract the principal components of all relevant indexes.
SPSS 19.0 is used for the extraction of the principal components of all input and output indicators. Of the 7 input indicators, 4 principal components are obtained. The accumulative contribution rate of these two principal components reaches approximately 86%. Of the four output indicators, one principal components is obtained. Its accumulative contribution rate reaches approximately 85%. The loads of the principal components of the input and output indicators are shown in Table 4.

Component matrix of the input and output indicators
Using the data in Table 4, the formula of the synthetic indicators of the operational efficiency of major ports in Korea and China can be expressed as follows. For the input indicators (four principal components denoted as I1,I2,I3 and I4). For the output indicators (one principal component denoted as O1) Thus, the values of the principal components of the indicators are obtained.
Given that the input and output values of the DEA model should not be negative, Log transformation is used to transform the PCA results. The results of the negative-to-positive transform of the principal components of the input and output indicators are shown in Table 5. The nonnegative data of the principal components in Table 5 are analyzed using the DEA model.

Negative to positive transform of the principal components of the input and output indicators
The DEA results will be shown in table 6. The results are based on results of DEA-CCR, DEA-BCC models obtained from maxDEA software. Table 6 shows the individual port efficiency scores. A value of 1 represents ideal efficiency. There are five ports to be regarded as efficiency (four Chinese ports Shanghai, Qingdao, Dalian, Xiamen and one Korean port Yeosu-Gwangyang). By analyzing the efficiency score in the DEA-CCR and DEA-BCC model, port inefficiency caused by pure technical inefficiency and/ or by scale inefficiency can be determined.

Efficiency of major ports in korea and china in 2016
If the DEA-BCC efficiency score is equal 1 but less than 1 in DEA-CCR model, then it reflects the port is technical efficient with scale inefficiency. For example, Table 6 shows the efficiency scores of Pyeongtaek port are 1 in the DEA-BCC model and 0.748 in the DEA-CCR model, reflecting that scale inefficiencies exist in Pyeongtaek port.
If the efficiency score of a port is less than 1 in both DEA-CCR and DEA-BCC models, it reflects the port has both technical and scale inefficiencies. Table 6 shows that the efficiency scores of Ningbo-Zhoushan were 0.983 in the DEA-CCR model and 0.997 in the DEA-BCC model, reflecting both pure technical and scale inefficiencies in the port. Such the technical inefficiency maybe caused by inefficient operations (such as the handling process of container cranes)
About return to scale (RTS), table 6 shows that there five ports are constant return to scale, four ports are increasing return to scale and other three ports are decreasing return to scale.
In general, the results of BCG matrix and DEA model show Shanghai not only has high position in the market, but also be an efficient port that keep Shanghai port always be in the first place while almost other Chinese ports are said should reduce their current scale. In term of Korean ports, While all the other Korean ports (even the largest port Busan and small ports) are said should increase their scale to get higher efficiency score, Gwangyang is highlighted as efficient port and higher market position currently. Therefore, with current development, we hope that Gwangyang port can have ability together with Busan port to compete with neighbour ports not so far in the future.
5 Conclusion
In this increasingly competitive landscape of port industry, it is important for port operators to constantly review the performance of their ports so that they can keep their competitive advantage. Within such a competitive environment, it is important to have a reliable measurement of port performance so that useful advice can be drawn to port operators or managers to improve their port efficiency and strategic position.
This study firstly employed BCG matrix with dynamic portfolio analysis to identify the competitive position of major ports in Korea and China. The portfolio results revealed that Chinese ports now are dominant players in term of container traffic and only Busan port has ability to compete with the Chinese ports. However, in term of other cargo types such as
Liquid Bulk or Ro-ro, there is a reversal with the dominance of Korea. While the ports of China has diversified and developed equally in all type of cargo, Korean ports seem to have opted for specialization with the leading container port of Busan, Liquid Bulk of Ulsan and Ro-Ro cargo of Pyeongtaek port.
After finding out the present competitive position, we will have more closely look inside individual port to evaluate their operational efficiency. Thus, this research which deals with measuring major Korean and Chinese ports efficiency using combination of PCA and DEA model. In order to measure efficiency, most of researchers have chosen DEA model; however, one of this model limitation is the dependence in the number of variable dimensions. Thus, the given solution is to combine DEA model with PCA model usually used for reducing dimension.
This part was divided into two steps: firstly, PCA model was applied to reduce the number of original input and output. After this step, there are four input and one output calculated based on the original ones. In the second step, using the result input and output of PCA model as the input of DEA model. The results showed that there are five ports (Shanghai, Qingdao, Dalian, Xiamen and Yeosu-Gwangyang) regarded as efficiency, Pyeongtaek port regarded as having scale inefficiencies meanwhile the others have both technical and scale inefficiency.
Finally, for the ports of China, Shanghai port always develops with a very strong position in the market with high operational efficiency. This is a testament to why for many years the port of shanghai has always been at the forefront. Ningbo-Zhoushan port has always shown that it is the right decision when conjunct together to help grow as high and fast as in recent years. In term of Korean ports, the specialization plan of port has also brought some great benefits to the country, but not enough to compete with Chinese ports. Among total five Korean ports, there is only one port regarded as having operational efficiency and the others have not high efficiency score, in comparing with Chinese port. In recent times, Korea has also combined with a number of countries such as Switzerland and Japan to implement the e-navigation project, a useful toolkit that aims to improve maritime safety, protect the marine environment and improve the efficiency of sea transport. In addition to implementing new policies, the introduction of e-navigation into the operation of marine-related objects (including seaports) will be largely effective and might improve the efficiency of ports in the future.
Acknowledgement
This research is a part of the project titled “SmART-Navigation project,” funded by the ministry of Oceans and Fisheries.