

Introduction
Connecting sea and inland transportation, ports play crucial roles in "logistics, production, information transfer, international trade, and the economic development of the hinterland" (Song and Yeo, 2004). As logistics nodes in the global network, seaports have adapted to changing economic and logistics systems (Notteboom, 2007). Ports and terminals, thus, strategically position themselves to facilitate users’ requirements with their supply chain (Panayides and Song, 2009).
Moreover, acknowledging competitive positioning enables a company to make strategic planning basing on its competitive position, such as preserving an advantage, attempting improvements, or withdrawing from a market (Fleisher and Bensoussan, 2007). Additionaly, a strategic plan that is derived from a well-defined market and a clear orientation toward growth is crucial to accommodate intensive competition, the need to gain competitiveness as well as shareholder profits, and contextual environment pressures. Thus, in the seaport industry, where the longstanding factors of advanced or new infrastructure are no longer sufficient to outperform rivals and competition is strongly determined by environmental conditions, strategic positioning analyses have spread throughout the companies (Cruz et al., 2012).
Vietnam is one of Asia’s fastest developing economies (World Bank, 2014). A long coastline of nearly 3,500 km provides a comparative advantage for Vietnam in developing a seaport system. Additionally, Vietnam’s seaport system is located in one of the most world’s dynamic shipping routes that connect Europe and Asia. Thus, the total throughput volume of Vietnam’s seaports grows year by year, especially in container cargo (World Bank, 2014).
Vietnam has a total of 44 seaports, which include 219 terminals with approximately 44 km berth length (Vinamarine, 2015). Ho Chi Minh City and Hai Phong are the two shipping centers in charge of 90% of the country’s total throughput. Comparative advantages deriving from the centralization of economic zones in satellite areas and the increasing cross-border trade with Southern China has boosted Northern Vietnam’s seaport system, achieving a rapid growth rate. From 2000 to 2011, the container throughput volume of the northern part recorded a 24.5% growth in comparison with the southern part that achieved a 14.3% growth.
In Northern Vietnam, the competition of container terminals has intensified due to the location of the container terminals close to the common hinterland. The majority of container terminals in the northern region are located in Hai Phong and along the mouth of the Cam river. However, related research on Northern Vietnam seaports has been conducted only in exceedingly limited research areas, such as measuring the efficiency and competitiveness of container terminals in Northern Vietnam (Nguyen and Kim, 2015; Nguyen et al., 2016). There is also scant research analyzing competitive positioning for container terminals in Northern Vietnam. Hence, this study looks at the competitive positioning of container terminals in Northern Vietnam during 2005-2014 by using Boston Consulting Group’s (BCG) matrix. This study can assist terminal operators and policy makers to establish strategic planning as well as improvement priorities for development.
Consequent part reviews the relevant literature about terminal competition and terminal competitive positioning. Section 3 discusses the applied methodologies. Section 4 and section 5 presents the results in terms of the competitive positioning of container terminals in Northern Vietnam and a conclusion, respectively.
Literature Review
Port competition is defined as “acquiring trade in specific traffic categories, with port operators (and their terminals) as the main actors engaged in this competition and with port authorities as supporting actors opportunities for-and imposing constraints on- the port operation directly and on the broader port cluster indirectly” (Haezendonck, 2001, p.14).
Traditionally, terminal competition is considered as competition among and within ports (Meersman et al., 2010). Verheoff (1981) named four levels of terminal competition, including competition between terminal undertakings, competition among terminal clusters, and competition among ranges. The determinants of competition would differ from levels. Labor, capital, technology, and energy are addressed as competitive factors in terminal undertaking competition. On the other hand, competition between terminals, terminal clusters, and terminal ranges is influenced by regional factors, named geographical location, infrastructure, industrialization, government policy, and hinterland.
In 2002, another classification was introduced by Van de Voorde and Winkelmans in which port competition includes "intra-port competition", "inter-port competition", and "inter-port competition". In the first level, competition is regarded as competition in terms of operator aspect between terminal operators, including all aspects of the containerized trade. In inter-port competition level, competition occurs between operators from different ports in same range, and serves more or less the same hinterland. The third level is inter-port competition aiming satisfying mission of seaports from port authority. However, in order to accommodate supply chain requirements, the traditional approaches must take into account competition between supply chains in which the optimal cost object is crucial. Thus, throughput, warehouse and distribution centers, and hinterland connections contribute considerably to terminal competition (Meersman et al., 2010).
Competitive position is regarded as its place in an industry or market compared to its rivals. Due to the aforementioned importance of seaports, a number of empirical studies and analytical techniques have been applied in order to categorize their competitive positions. In 2001, Ircha used a strengths, weaknesses, opportunities, and threats (SWOT) analysis to suggest strategic planning for the growth of Canadian ports. With the same purpose, Cruz et al. (2012) analyzed the strategic positioning of the leading Iberian Peninsula seaports from 1992 to 2009 using the Boston Consulting Group’s (BCG) matrix. This methodology was also applied by Haezendonck et al. (2006) to clarify the competitive position of seaports in the Hamburg-Le Havre range.
In Northern Vietnam, a competitive positioning analysis has not been conducted by any scholars. Nguyen and Kim (2015) and Nguyen et al. (2016) studied the relative efficiency and competitiveness of container terminals in Northern Vietnam by using data envelopment analysis (DEA) and hierarchical cluster analysis. To shed light on terminal competitive positioning, it is essential to study the competitive positioning of container terminals in Northern Vietnam during 2005-2014.
Methodology
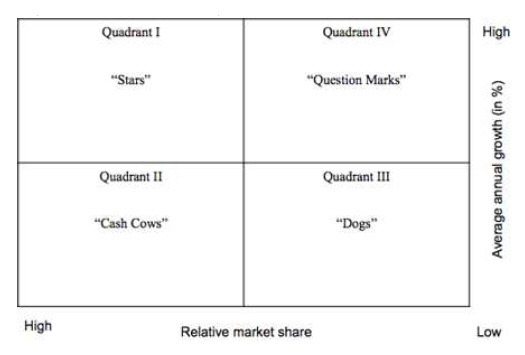
This section introduced the applied research methodologies utilized to achieve the objectives of the study. The Boston Consulting Group’s (BCG) matrix is an optimal tool for the assessment of the competitive positioning of container terminals (Haezendonck et al., 2006). In the 1960s, the Boston Consulting Group (BCG) introduced a method to enhance strategic planning by a “growth-share matrix” (Henderson, 1970) Although this method has been criticized as overly simplistic and its growth rate measure was deemed insufficient for assessing the attractiveness of an industry (Porter, 1980), many planners and policy makers have utilized this matrix as the most popular tool that can assist with developing strategic plans (Cruz et al., 2012; Haezendonck et al., 2006; Terwiesch and Ulrich, 2008).
This original technique takes into account the actual industry market share for each of the firm’s businesses with related growth rates, and thereby decisions related to cash flows and profitability can be made (Hax and Majluf, 1983). In terms of the market growth rate, the indicator aids in measuring the attractiveness for the industry based on "the business life-cycle concept" comprising four phased, namely "embryonic", "growth", "maturity", and "aging" that has crucial implications for establishing strategic planning basing on its life-cycle. Additionally, to define a company's strength in a competitive market, it need to clarify the relative market ratio against the most largest competitor, as a result of a positive relationship between market share and profitability (Hax and Majluf, 1982).
In the context of container terminals, the matrix is used to discriminate among terminals according to the nature of their relative market share and annual growth rate in total container traffic volume (Notteboom, 1997). The BCG matrix make a distinction between four market positions: “question marks” imply that the high potential future of the terminal regarding growth but market share is still relatively uncertain, “stars” have a high potential future, “cash cows” indicate terminals or terminal ranges experiencing in the maturity phase, and “dogs” imply few or no prospects for further development (Day, 1977). Figure 1, 2
Case study
4.1 Overview of container terminals in Northern Vietnam
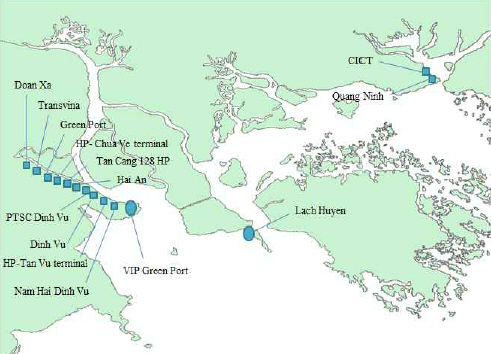
All container terminals in the north part of Vietnam are located in Hai Phong and Quang Ninh. Currently, only two terminals are in Quang Ninh, named Quang Ninh and CICT, and the rest are in Hai Phong, which has geographically comparative advantages and a hinterland advantage. In comparison with Quang Ninh province, the development of Hai Phong’s seaports has been given priority not only on a local level, but also on a national level. Most of the great plan is the construction of the international gateway port located in Hai Phong that is scheduled for completion in 2017 and is expected to contribute to Vietnam’s growth into a strong sea nation.
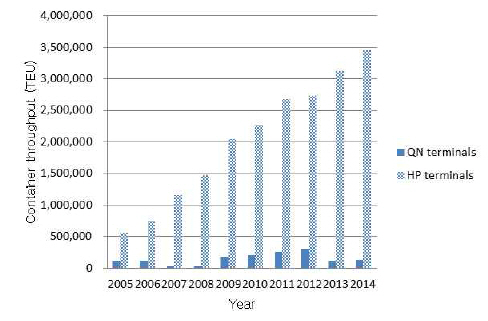
Table 1 illustrates the differences among container terminals in Northern Vietnam from 2005 to 2014. The changes in the throughput of container terminals in Quang Ninh and Hai Phong are presented in Figure 3. As a result of Hai Phong’s comparative advantages, its container terminals are in a position of dominance in the region, causing the demotion of the Quang Ninh terminals. In 2005, there were only five container terminals achieving a total throughput of 700,000 TEU. The numbers of terminals and throughput increased dramatically to 11 and 3,600,000 TEU, respectively, in 2014. However, all terminals in the system are limited by the number and length of berths to handle containers, except for Hai Phong, which has two terminals (Chua Ve and Tan Vu) with a total of 10 berths. Additionally, most container terminals possess limited deep-channel draft and berth length, especially in the Hai Phong area, that hinders the accommodation of larger vessels.
Table 1
Container terminals in Northern Vietnam, 2005-2014
4.2 Competitive positioning of container terminals in Northern Vietnam, 2005-2014
The data used for this study was collected from the Vietnam seaport and includes the container terminal throughput (TEU) in Northern Vietnam from 2005 to 2014. All terminals operating in the Northern part of Vietnam were studied.
In Figure 4, all the container terminals in Northern Vietnam are shown as a portfolio of terminals. The different terminals are positioned in the growth-share matrix based on their relative market share and average market growth rate of container traffic from 2005 to 2014. In regard to market share, the dominance of Hai Phong terminal and, to a lesser extent, Dinh Vu and Nam Hai Dinh Vu, is obvious. However, Hai Phong terminal is positioned as a “cash cow” that is situated in the maturity phase as a result of a declining growth rate year over year. Similarly, Only Dinh Vu and Nam Hai Dinh Vu are considered “stars" as results of surpassing the average market share and the annual growth rate during the period of observation.
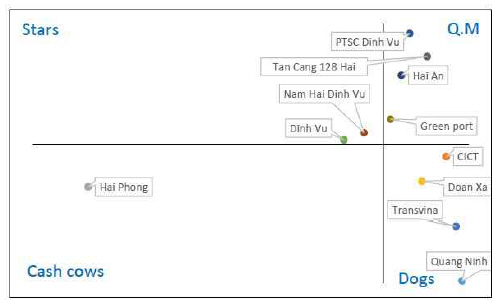
Among the container terminals with “question marks” are PTSC Dinh Vu, Tan Cang 128, Hai An, and Green Port. In spite of the fact that PTSC Dinh Vu has the highest annual growth rate in the portfolio, its relative market share remains deficient to give it a “star” status. The remaining terminals, named Quang Ninh, CICT, Transvina, and Doan Xa, positioned as “dogs,” have low annual growth rates as well as relative market shares, less than 30% and 0.4, respectively.
A dynamic analysis would complement the static analysis to provide insights into the evolution between the different time periods (Haezendonck et al., 2006). Thus, three time periods were selected: 2006-2008, 2009-2011, and 2012-2014.
Figure 5 depicts the dynamic positioning of container traffic in seven terminals, which includes more than one period of time. The lines represent chronological order based on the time periods. The relative market shares as well as the average market growth rates of the selected container terminals have fluctuated over the years. In terms of relative market share, the highest amount of fluctuation can be found in the Hai Phong terminal, with a decrease of from about 35% to 17%. With a corresponding decrease in growth rate, the Hai Phong terminals lost the “star” position in the first period to a moderate “cash cow” from the second and the third periods. In contrast, the relative market shares of Quang Ninh, Transvina, and Doan Xa remained fairly stable, but were confronted with a declining growth rate causing moves from “question mark” to “dog” positions.
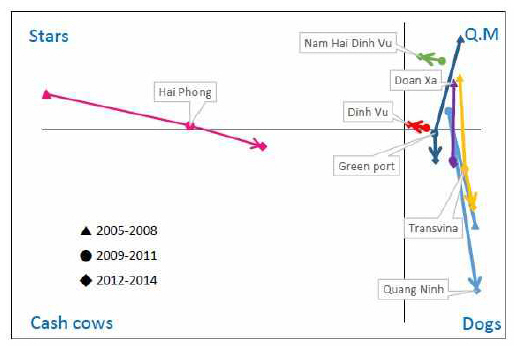
Dinh Vu and Nam Hai Dinh Vu are the only terminals that have increased constantly during the observation period. Both the terminals tended to move from their position in “question marks” to the edge of the “star” position.
Green Port was considered a “dog” as a result of losing its position in “question marks." Although, experiencing an increase of relative market share in the first period and a slight decrease in the next period, a significant decline in average growth rate from about 66% to 17% in the second period and to approximately -9% in the last period.
Conclusion
5.1 Discussion and Implications
This study applied the growth-share matrix method to provide insights into the competitive positioning of 11 container terminals in Northern Vietnam. Although the Hai Phong terminal has the leading role in the market, the terminal’s competitive positioning is weakening in comparison with its rivals over the years. In the meantime, Nam Hai Dinh Vu and Dinh Vu increased competitive positions as the result of an increasing relative market share and growth rate in parallel. Other terminals, such as Quang Ninh, PTSC Dinh Vu, Hai An, and Tan Cang 128 Hai Phong demonstrated great promise as newcomers that had the highest annual growth rates in the system.
Similarly, CICT, which was established in 2012, had a satisfactory performance and gained market share in Quang Ninh. Although the terminal is considered as being in a “dog” position, it will be a strong player when it becomes fully operational at 1,200,000 TEU compared to 102,000 TEU in 2014. In contrast, Green Port was losing its competitive position, which is clearly shown by moving from the “question mark” position to the “dog” position, although its average growth rate from 2005-2014 was positive. Thus, to enhance Green Port’s competitive position, VIP Green Port, which was launched at the end of 2015 as an expanded terminal of Green Port, will be a strong competitor in the system. The remaining ports, Transvina, Quang Ninh, and Doan Xa showed that their competitive positions have narrowed as minor performers.
The competitive positioning of container terminals in Northern Vietnam will fluctuate dramatically in the near future when the Lach Huyen International Gateway Port, located in Hai Phong, opens in 2017. It is designed to accommodate 4,000 TEU, and then 6,000 TEU to 8,000 TEU after its expansion, and will become the largest port in Northern Vietnam.
This study offers some important implications for managerial viewpoints. Terminal operators will gain insights into their competitive positioning in the industry as compared to rivals, and thereby strategic planning will be easily created. That is meaningful preparation for terminal operators in Northern Vietnam as competition will be intensified as a result of the opening of the Lach Huyen deep water seaport as well as some terminals achieving full capacity. Decision making about future resource allocation is useful not only for terminal operators, but also for policy makers, to improve the system and gain efficiency.
5.2 Conclusion, limitations, and future research
As an engine for the economic growth of the northern part of Vietnam, especially for Hai Phong, the developing port industry is being given priority over other industries. Thus, understanding a port’s competitive positioning in the system is essential to outperform rivals.
This study analyzed all the container terminals in Northern Vietnam by adopting a growth market matrix in order to clarify terminals’ comparative positioning in the market from 2004-2015. With the comparative advantage of geographical location, the majority of the container terminals in Northern Vietnam are located in Hai Phong, which affirms the stronger competitive positioning of these terminals in the industry. Notwithstanding the fact that the Hai Phong terminal dominates the market, the terminals Nam Hai Dinh Vu and Dinh Vu are considered as “star” performers. Quang Ninh, Doan Xa, and Transvina are losing their competitive positions in Northern Vietnam.
Although the study focuses on container terminals in Northern Vietnam, in order to obtain a better assessment regrading competitive positioning, future studies should adopt a wider scope to include all container terminals in Vietnam. Additionally, clarifying the competitive positioning of container terminals is valuable for decision making and resource allocation, but the factors that contribute to enhancing competitive positions have not been identified. Thus, future research needs to examine which factors influence the competitive positioning of container terminals.
 PDF Links
 PubReader
 Full text via DOI
 Download Citation
 Print
Print


