


1. Introduction
Busan port is the busiest transshipment port in North-East Asia and the 2nd largest transshipment port in the world only after Singapore. Nevertheless, Busan port is facing tough competition from Chinese ports who are endeavoring to increase their handling of transshipment cargo. Also Japanese Government started up ambitious plan to foster domestic major ports clearly targeting to redirect their local portâs cargo which is mainly transshipped at Busan port to their selected main skeleton ports. Furthermore, increasing trade conflict between America and China who currently account for over 50% of T/S cargo of Busan Port are weakening steady growth potential of T/S volume in Busan port and recently emerged trade tension between Korea and Japan may have negative impact on the stable prospect of growth as well.
Whereas, Korean Government is continually expanding New port and recently announced phaseâ
Ą New Port development plan expecting to build Busan port as the central port in NE Asia. Such expansion plan has premises, however, Busan port may achieve sustainable progress even amid of many confronting uncertainties. On the contrary, if such a large scaled development is not supported by the incessant volume growth, that will yield the over capacity of the facilities which may give rise to the competition for capturing cargo among terminal operators in the port, hence, may cause deterioration of qualitative growth and inefficiencies in financial injection in the end.
Busan port, has arrived at an almost stagnant stage of the sustainable growth because of two factors in large. These are, first, the âadvancement of industrial structureâ having weakened physical distribution function by the Container and, secondly, ârelocation of manufacturing baseâ to China and countries in Southeast Asia, where cheaper labor costs are an advantage for manufactures. These two trends will not be changed and rather deepened for very long while in future. This apparently indicates that Busan port has to find new strategy for the sustainable growth, with one option being to increase its handling of transshipment cargo in stead.
In the mean time, that strategy may be only achieved when Busan port has to offer favorable and better conditions than competing neighboring ports, in NE Asia, to carriers who may have not a few options in selecting major T/S ports.
By large, it is known that shipping companies are taking two requirements into consideration when choosing main T/S ports among possible candidate ports, Shortened lead time in entire transportation and Minimization of the costs for handling vessel and cargo. To satisfy such imperative prerequisites, shipping companies may have diverse points into their scope of decision for checking if port has better Geographic condition, well structured Connectivity with origin and destination of the cargo, high Productivity and Service level of the port, Convenience in the policy and Cost Competitiveness.
Recently, Alliance of the Shipping companies has been restructured into 3 major entities and ocean going carriers have been reduced to 11 companies through the busily M&A mainly triggered by the long depression of the industry. This downsizing in the structure gives strong implication that volume power of the Carriers has been recognizably strengthened, therefore, unavoidable volatility of the throughput in the ports may be critical phenomenon when ports are not able to respond to such a trend change and, in fact, some examples which are showing such cases are witnessed in South and North Asian ports very clearly. On the other hand, when ports respond to such new trend efficiently, they may have bigger pies thereupon and this will undoubtedly contribute for the development of the logistics industries of the nation.
This paper is, purely motivated by the intention to find new breakthrough for the sustainability of the Busan port and suggest appropriate policy plan to Government, written to analyze and understand the Carriersâ strategy when choosing T/S ports and evaluate how Busan conforms to its requirement as T/S port.
2. Theoretical backgrounds and Preceding Researches
2.1 Factor Analysis of the T/S competitiveness of the Port
2.1.1 geographic condition of the port
To carriers it is of the utmost importance to accomplish transportational contract with their clients safely and quickly. However with the enlargement of the vessel size and subsequent reduction in number of calling ports largely therefrom, shipping companies can not avoid the operation entailing transshipment of the cargo. Drewryâs transshipment handling estimate(full and empty) for 2019 totals 206.0 million TEU, representing a rise of 3.4% compared to 2018 and accounted for 25.7% of total worldwide container volume1). To operate optimally within such an environment, carriers strategically opt to utilize transshipment hub ports which may alleviate additional cost and time pressures.
As shown on Table 1, almost all the global hub ports are located at the center of the global trade routes. For instances, Singapore is located on the Asia-EU trade lines which has the largest trade volume in the world. Busan also is the nearest Asian port crossing the Pacific ocean from America who is the country of G1 and centered between China and Japan who are the countries of G2, G3 while connecting them with highly developed feeder networks. From the perspective of locational point of view, the existence of competing port also matters. Tanjung Pelepes and Port Klang in Malaysia fastly grown up with the strength in the cost competitiveness to compete with Singapore who has long enjoyed the status of unrivaled hub port in SE Asia. Busan port also has long maintained the status of gateway port in NE Asia, however, may have chances to lose exclusive status if Shanghai, Ningbo and Qingdao change the direction to T/S cargo from gateway cargo because of the proximity to those potential ports.
2.1.2 Network with foreign ports
Transshipment of cargo occurs mostly when no direct service between origin and destination of the shipment is available. It may also occur when a carrier provides a contractor with a faster transit time, however, this is rare, and usually not preferred by both the carrier and consignor (consignee) due to extra expenses. Shipping companies are implementing many possible strategies in order to save on costs and time when transshipping, however, âconnectivityâ is one of the most imperative factors to consider.
To become a global port, as aforementioned, the locational condition should be satisfied by connecting origin and destination cheaply and rapidly. If closely check the background how Busan port emerged as global hub port, sophisticated connectivity with most of the local ports in China and Japan is found to be most powerful contributor.
Above Table 3 shows PLSCI of the top 10 ports as of 2019 annually released by UNCTAD since 2006 targeting 900 ports in the world. These statistics are mainly based on the data from 6 items which cover comprehensive operational situation of the ports. According to the data, as shown above, Busan port is investigated to position at the 3rd followed by Shanghai and Singapore although total handling volume is not reaching that position. In the mean time, with the research for the Container Liner service Routes pattern, Ryu et al.(2018) put Busan as a few port having higher âcentralityâ together with Singapore2) among major global ports.
2.1.3 Port Productivity and Port Infrastructure
The level of Port productivity and infrastructure play very important role in ensuring minimized port time of the vessels. For efficient fleet operation which are tightly interconnected, shipping companies are highly evaluating level of port productivity when fixing the itinerary of the service because it affects direct cost control in many ways.
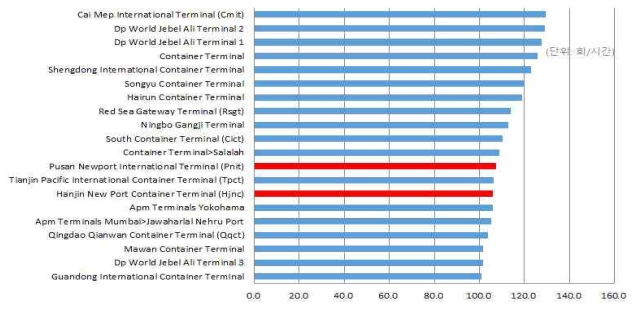
To assess the productivity of the port, Gross Berth Productivity is widely used which counts the numbers of container box handled at the berth for an hour. In fact, the authentic way to achieve higher productivity is to increase resources of laborer and cargo handling equipment. Fig. 1 contrasts portwise productivity of the ports, however, PNIT, HJNC in Busan New port are positioned only at the middle range among global ports.
2.1.4 Port Service and government policy
Port service level is assessed by various factors mainly such as weather condition, operation interruption by port workersâ strike and availability of various attached services. Port service level is as important as port productivity when shipping companies choose T/S port because it also directly affects shipping companiesâ cost control and may interrupt scheduled vessel operation. Shipping companies want ports to be always ready even when vessel arrives later than fixed schedule although the late arrival should be attributed to themselves. In case of Busan port, vesselâs arrival is severely concentrated on the weekends, hence, there are many cases of berth congestion during weekends. In the mean time, Governmentâs stance about T/S cargo is important factor in choosing T/S port. If tough regulation for handling T/S cargo exists or when strong customs surveillance on the T/S shipment is assessed, shipping companies may find easier port for smoother cargo handling. When Port Authorities have clear objectives to develop ports as T/S port, they have to show appropriate signals to shipping companies.
2.1.5 Cost Competitiveness
There are various expenses that shipping companies must pay when handling transshipment cargo at the port. In order to make precise cost comparisons to accurately establish a portâs profitability, shipping companies operate a cost control system which calculates unit costs per TEU. Among the expenses, cargo handling charges at the terminal are the biggest burden, and rates are largely fixed via negotiations between the carrier and terminal operator. The factors most affecting Terminal Handling Charges (THC) are the structure of the portâs berthing facilities, and the cargo demand at the port, in commercial ways, only if Port Authority does not fix and assess the unified tariff applicable to all players disregarding the negotiation between vessel operator and terminal operator.
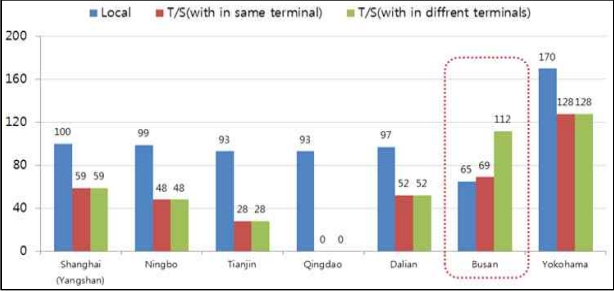
Fig. 2 shows THC level comparison among ports in Japan, China and Busan. This indicates, in comparison only between Busan and Chinese ports, THC level of gateway cargo(Export & Import cargo) in Busan is much cheaper than that of Chinese ports, whereas, T/S cargo is vise versa implicating cost competitiveness in T/S cargo of Busan port is much weaker than Chinese ports.
The main reason for this situation can be explained by the type of cargo in the ports. The proportion of T/S cargo in Chinese ports falls short of 5% of entire volume, in average, hence, terminal operators may have high flexibility when they make rate contract with carriers by often giving big discounts and this rarely influences on terminal operatorâs revenue scale. On the other hand, T/S proportion, particularly T/S between the different terminals, in Busan is around 53% of total volume of port and this high proportion restricts flexibility in rate contract for T/S cargo. The more threatening thing is Chinese portsâ bigger rooms for attracting more T/S cargo by using higher cost competitiveness in T/S cargo than Busan port. Shipping companies consider many factors including cost level of port when fixing T/S port, however, cost in the port can have the biggest weight especially when shipping industry is under depression. The fundamental background, if deeply checked, of weaker competitiveness than Chinese ports relates to two factors, by and large, from multiple terminal operator system and absence of Global carrier owned terminal in Busan.
2.2. Environmental analysis of Busan as T/S port
2.2.1 Two ports system
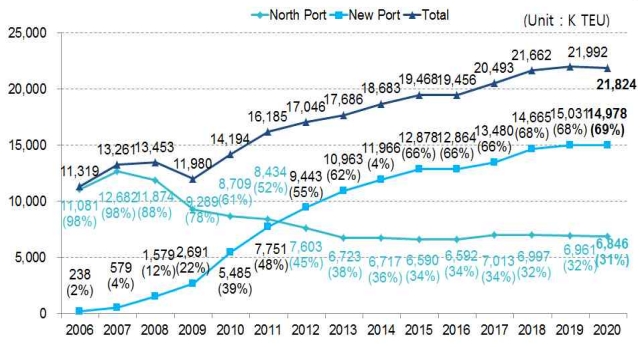
Busan port consists of two ports complex, Old port and New port, of which New port is steadily increasing proportion of volume, as of 2020 by having around 70% of Busan port, with high speed since opened in 2006.
In future concentration into the New port will be fastly strengthened supported by its capability to accommodate developed infrastructure matching upsizing trend of container ships. However, current two port operational system gives rise to problems weakening T/S competitiveness by increased costs for ITT(Inter-Terminal-Transportation) between Old port and New port. Busan port has large portion of T/S cargo with Japan, China and the ships covering these nations are mainly calling at Old port, then, connecting freights with ocean-going ships calling New Port. To alleviate carriersâ cost burden for ITT between two ports, Old port has to be shut down and all the logistics functions in Busan port should be integrated into New port from the long term perspective.
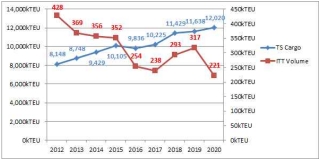
Ocean going shipping companies are now endeavoring to reduce ITT volume as much as they can do through rationalization of fleet operation, however, terminals in New port barely reserves ample capacity to feeder carriers using Old port, whilst if then, Chinese and Japanese T/S cargo will be well connected inside New port efficiently. According to the rate guideline published by the government3), the truckage between Old port and New port is around KRW114,000(USD100), which is almost equivalent to the expense for cargo handling inside terminal. What this two port system implicates in the T/S competitiveness of Busan is its severely negative impact on cost competitiveness of Busan when connecting T/S cargo between two ports. As shown below Table 5, the general trend of ITT volume is not remarkably reduced for the last several years in spite of carrierâs rationalization of fleet operation by integrating service into New port.
2.2.2. Multiple terminal operators
Dedicated container terminal operation in Busan port started since 1978 with opening of HBCT which is now operated by Hutchison Korean Terminals. Through the partial integration most of which was done among domestic stevedoring companies, Old port having 17 berths are being operated by 3 operators(HBCT, BPT, DPCT)4) and handling about 30% of entire container volume of Busan port. Before starting integration of terminal operator, 8 companies were engaged in the terminal operation in Old port only. The integration initiated from the plan to discourage immoderate rate-cutting competition among terminal operators rather than operation rationalization to improve efficiency of terminal operation. New port, whereas, has 5 dedicated container terminals since 2006 when the first terminal PNIT5) started operation together with 1 multi-purposed terminal (BNMT). Now BPA is constructing 5 berths(Phase 2-5 & 2-6) aiming to open from 2023 and BCT whose major shareholder is Korean construction company starts operation with 3 berths from 2nd half of 2022. If current construction is finished, there will be two more operators added, then, 7 operators become to operate 29 berths only in New port. If adding up with Old port, Busan port has 10 operators. This multiple terminal operator system will apparently show non-negligible operational inefficiencies in handling T/S cargo reaching 70% of New port volume. Two important inefficiencies are coming first from added ITT cost by which carriers should take for T/S between different terminals because of failure to handle T/S cargo by ship to ship within the same terminal. Secondly, with the trends of alliances restructuring and vessel up-sizing, terminal has to facilitate longer quay walls and more cranes to improve productivity for which sharing quay and equipment between operators can be very effective method to maximize the utilization of the resources. However, multiple operators who only operate terminal with owned resources, though it is general practice seen at the industry, have to put up with the loss of opportunity to increase utilization of resources. Shin et al.(2020) showed, through the simulation, that only sharing Quay wall and Quay crane among terminal operators may give similar effect of operational integration in reducing waiting time of vessel and cost saving effect in ITT also can be achieved when Y/T sharing is available6). Old port may not have the benefit from integration, in operation at least, because of scattered locations of the terminals, however, New port may have remarkable benefit, by sharing berth and cranes, from the integration or from the joint operation at least.
In spite of several benefits gainable from the integration and urgency of its necessity in order to enhance the T/S competitiveness in front of strengthening challenges from neighboring countries, also fully common sensed as so among terminal operators, complicated structure of terminal shareholders interrupts timely behavior and decision makings. Whereas,, Singapore who is similar to Busan by having high portion of T/S cargo has single operator system, PSA, while HongKong achieved operational integration among HIT¡MTL¡ACT in an effort to recover top ranked position in the past. If check the correct reason why Busan became to have multiple operator system, it should be attributed to several reasons comprising phased port development and concession contract with different operators after construction first, secondly absence of national GTO, thirdly Governmentâs misdirection of strategies in building Busan port in NorthEast Asia central port7).
2.2.3 Excessive ITT Volume
Recently, global shipping alliances have been restructured into three groups, and this change has resulted in increased power for carriers when dealing with terminal operators. With individual alliances now having higher number of fleets, terminals must ensure that they are readily able to accommodate all or most of an allianceâs fleets, or else risk the alliance taking their cargo elsewhere for transshipment. Accommodating all of a single allianceâs fleets at one terminal requires six berths handling at least 5 million TEU per year.
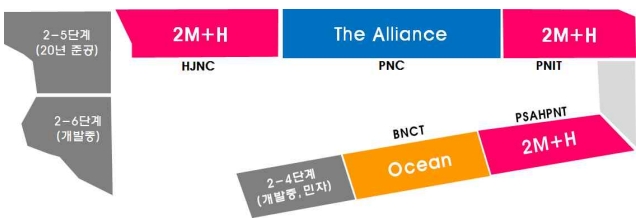
However, in Busan port, only PNC operates 6 berths and the other operators have 3 to 4 berths only8). This situation made by aforementioned reasons is giving cost disadvantage to carriers who have to move their T/S cargo from one terminal to the other paying truckage for ITT. According to recent data, T/S cargo volume in Busan, as of 2020, is 53% of total volume and about 35% of it is known to need ITT for T/S. As shown on Fig. 4, 2M consisted of global number 1(Maersk) and 2(MSC) made contract with two terminals(PNIT & HJNC) and their T/S volume was sharply decreased in 2019 and this affected dull growth rate of 1.8% in T/S cargo which is far below than annual average in Busan. In case of Singapore and Hongkong having high T/S volume as Busan, it is known that terminal operators are offering free ITT service to carriers in order to ease carriersâ additional cost burden and take fundamental measurement through operational integration by giving one-stopped service. Busan, however, is only subsidizing carrier with some portion of actual cost incurred from ITT at the pretext of incentive.
To settle down ITT issue in Busan fundamentally there is no other way but integrating terminals and shifting operation in Old port to New port in short period. When integrating terminals, type of One operator, like Hongkong, than One company, if hard to make it soon, should be proceeded first with urgent priority.
2.2.4 Non-Global carrier terminal
In major ports of the world, almost all the global carriers are operating their own terminals by either receiving concession from Port Authorities, which is typical type in terminal operation, or developing for themselves by having PPP(Public-Private-Partnership) contract with government. Global carriers utilize the terminals as their âCost centerâ9) together with ensuring punctuality in vessel operation. Under Alliance system, from the point of volume of the terminal, the effect of volume concentration appears high because all the member carriers belong to identical alliance group use the same terminal when they fix the contract.
HMM purchased 40% of HPNT from financial investor and started co-operation with PSA since 2018, however, Global mega carriers did not have chance to receive concession from Port Authority. Global carriers may not have sensed to operate own terminal in Busan because of stable rate structure which is favorable to them and sufficient berth supply enough to guarantee market structure at which carriers could stand higher than terminal operator.
However, considering that carriers always give higher priority to owned terminal port in fixing the T/S port, Port Authority has to take more strategic decision when developing terminal and choose operator of it. PSA, for instances, attracted Global carriers, such as CMA-CGM, MSC, as responsible shareholder in PSA terminals and extended such efforts to attract more carriers by making Joint Venture in order to make them bring more T/S cargo in front of competition with PTP in Malaysia located very close from Singapore.
On the contrary, Busan Port recently failed to attract Global carrier as operator for phase 2-5 tendering which will be opened in 2023 losing the justification to develop Busan as competitive Global T/S Hub port.
2.3. Global T/S Ports Environment Analysis
2.3.1 Singapore
Singapore has been long maintaining the title as unrivaled global No. 1 T/S port. If analyzing the backgrounds for that, several factors appear to contribute for the position of Singapore. First, Singapore has very strong Locational merit being located at the main Trunk route connecting Asia-Europe. Second, Singapore retains excellent network power connecting South East Asian ports with global main ports. In almost all the researches regarding Connectivity, Singapore always stands No. 1 or No. 2 competing with Shanghai only. Third, more importantly, Singapore is exclusively managed by single GTO, PSA, which enables terminal operator to provide customers with one-stop tailor-made service. Within the core terminal business PSA was early to recognize the importance of securing volumes from Key carriers, especially in Singapore where it faces stiff competition from nearby Tanjung Pelepes. It has established JVs for terminal operationss with COSCO, CMA CGM, MSC, PIL and in may 2019 signed a new JV with ONE10). Carriers also show very proactive stance on PSAâs offer because they can receive virtual dedicated berth guarantee from PSA and this is very useful for their smooth fleet operation at all times. Meanwhile MPA(Maritime Port Authority of Singapore) shuts down terminals, Keppel, Brani, Tanjung Pagar, Pasir Panjang which all locate within urban boundary by stages and newly opens TUAS having full automation system from 2022. If compare Singapore from the point of competitiveness as T/S port with Busan, Locational merit, Overseas Networks assume to be almost equal, however, very noticeable difference is the level of Port service: One single GTO vs Multiple terminal operators system which means Singaporeâs high cost advantage in handling T/S cargo handled at the scattered terminals.
2.3.2 Hongkong
Hongkong once enjoyed the title of global No. 1 port, however, is now suffering very sharp volume decline with the rapid development of neighboring ports, Guangzhou, Shenzhen, in Guangdong province of mainland China. Overall Pearl River Delta area which is known as global manufacturing base will not provide Hongkong with sustainable growth power as before because of global supply chain relocation to South East and South West Asian countries. If look closely the basic reasons explaining the crisis of Hongkong, more expensive cost level which is higher than adjacent Chinese Ports can be important reason. In addition, not officially confirmed, Chinese governmentâs easing the Cabotage rule by making Chinese ports take domestic cargo which once only handled in Hongkong because of Cabotage rule which allows no foreign flagged carriers to transport within national ports. With the change of policy, many of the carriers changed the T/S port from Hongkong to Guangzhou, Shenzhen because of the difference in T/S cost level. In spite of weakened competitiveness, Hongkong still has outstanding port operation capabilities supported by Hutchison Port Holding who is the 2nd Global Terminal Operator in the world. As to Locational strength, as same as Singapore, Hongkong retains high competitiveness as T/S port well located at the center of entire Asian regions.
In the mean time, Government of Hongkong announces ports performances counting midstream11) T/S volume as international T/S cargo, however, Drewry publishes ports performance excluding midstream volume as international T/S volume, hence, Busan is published as the world 2nd T/S port and Hongkong, once midstream volume excluded as Drewryâs announcement, is to be 6th T/S port after Dubai.
If compare T/S competitiveness of Hongkong with Busan, Location, Network power and Port service are evaluated to be almost equal level, however, Hongkong, in 2018, has achieved operational integration among 5 operators, from which Busan port has to benchmark in the examples of Hongkong in order to accomplish integration smoothly and enhance T/S competitiveness thereupon.
2.3.3 Dubai
Dubai is the globally 5th busiest T/S port and has long been fulfilling the role of central port in Middle East. Undoubtedly there will not be any change of Dubaiâs status in playing the role as central port in the region very long because of geopolitical reasons.
As shown above Table 10 whole Dubai port is managed and operated by single GTO, Dubai Port World(DPW), as Singapore. The full-fledged growth of Dubai port much owes to very creative policy initiative represented by Jebel Ali Free Zone first developed since 1985 and JAFZ is globally benchmarked as the good model how well Free Trade Zone and Ports coexists for achieving common goals. PNC in Busan New port is the DPWâs heaviest investment business unit as the first shareholder. If compare Dubai with Busan as the T/S port, both the ports share very similar strengths in the Location, Network power, however, one difference, as the case of Singapore, is seen at the structure of port operators: Single operator system(Dubai) vs Multiple operator system(Busan).
2.3.4 Tanjung Pelepes(PTP)
PTP is the 3rd busiest T/S port globally and has developed as representing port with Port Klang in Malaysia. In total portâs volume of PTP, T/S cargo volume reaches overwhelmingly up to 95%. The answer to the question how PTP has achieved such a surprising growth in short period while having Singapore just around corner can be found from the strategy to attract Maersk into the operator and investor of PTP. Before investing PTP, Maersk used Singapore as the key hub port in South East Asia, but, since relocation of major T/S hub in South East Asia from Singapore to PTP, Maersk is steadily increasing the portion here. In the industry, Maerskâs investment in PTP was perceived nsidered as the strange case because Singapore was the only choice to carriers operating strong network laying Singapore at the central position.
Maerskâs successful anchoring at PTP is a good example of a transshipment port joining with a competitive carrier to achieve success.. For close proximity, Singapore having higher advantage in network and port operation skills and PTP having cost advantage have to continue the competition without no choice. In an effort to frustrate PTPâs strategy to attract more T/S cargo from Singapore, PSA is reacting with expanding collaboration with carriers by inducing them into the terminal operation through the Joint Venture formation.
If compare PTP with Busan again, two ports share similar strength level in Location, but, one thing differentiated point is seen clearly: One single Global carrier operator(PTP) vs Multiple operator(Busan)
2.4 Implications from the environment analysis
This research compares and analyses the worldâs major, global transshipment ports in terms of factors affecting their competitiveness. The comparison and analysis of Busan Port and other major global hub ports identified several differences. Below is the summary of the noticeable differences identified among the ports in the analysis:
First, difference is found in the structure of terminal operators. Foreign ports commonly have monopolized or minority port operator system unlikely to Busan having multiple operators. In case of Singapore, entire terminals are managed and operated by one single GTO, PSA, and Dubai is also as so by DPW. In case of PTP and Hongkong also, port operation is virtually given to Global carrier and GTO exclusively. As explained in this chapter, this kind of monopolized operator system is giving their customers very favorable benefit in operating vessels and cargoes by providing carrier-oriented service including ample berths and equipment which direct to cost saving effects of carriers.
Second, all the global hub ports have geographical merits including Busan. Singapore is located at the place mainly connecting between South East Asia and Europe. Hongkong has been playing exclusive gate of the Southern China. Dubai plays key role in Middle East hub by taking advantage of outstanding network in the region and this status assumes to be maintained for long while. In case of PTP, it shows good examples how port can be developed by attracting global carrier once if having good location.
Third, important difference between Busan and other global hub ports can be found in the integrated terminal operation and Global carrierâs participation as terminal operator. Singapore and Dubai are having exclusive terminal operation system operated by the public companies, PSA and DPW, totally owned by the states or State owned national funds. One thing which gives an implication to Busan is achievement of operational integration among terminals under the auspice of Hutchison Port in Hongkong in 2018. Hongkong, once ranked as global No 1, is suffering unstopped cargo leakage to Shenzhen and Guangzhou who have cost advantage than Hongkong in the cargo coming and going from/to Guangdong province in China. While to make One integrated company is not easy, Integration in operation first can be alternative showing similar effect in operational competitiveness. PTP is also good example to Busan where no global carrier operates own container terminal by making partnership with Maersk who, then, has greatly contributed for promoting PTP as the 3rd busiest T/S port in the world. To respond to the competition from the competitor in the front yard, PSA also had to attract carriers to Singapore by establishing Joint Venture with reputable carriers in order to block further cargo outflows to outside.
Finally, the types of operator also differ. The Port of Singapore is exclusively operated by the biggest GTO, PSA, while the Port of Dubai is exclusively operated by the fourth biggest GTO, DPW. Similarly, PTP is exclusively operated by APM Terminal, under the Maersk group. Though the Port of Hong Kong is not solely operated by Hutchison port, they are virtually leading industry by offering global standard operational capabilities.
To show the contrasts between Busan and Global T/S ports, it can be summarized again that Busan has multiple operators of 8 and no global carriers operates own terminals. Due to unavailable combined operation as the case of Hongkong, carriers using Busan have to call at several terminals by shouldering additional ITT costs for T/S in different terminals.
2.5 Preceding Research Analysis
Rim, Il-Kyu, Kim Myung-Jae, Ahn, Ki-Myung(2010) analyzed âT/S cargo attraction strategy of Busan portâ with the global carriers sampled by using the competitiveness comparison with Chinese ports. This study concluded cheaper cargo handling cost, simplification and convenience of T/S cargo handling process, level of feeder network availability, export/import cargo volume scale and proactive marketing activities can be substantial strategies to increase T/S volume of Busan port. In overall comparison with Chinese ports, Busan has advantages in the duration of port operation while many of the Chinese ports have longer time of port close because of weather conditions. On the other hand, Chinese ports have advantages in the comparison with Busan in the cost level of T/S cargo. In the conclusion of this research, Port service level, network with overseas ports and cost competitiveness are explained as the factors when global carriers fix the port of T/S, then, writers viewed identical standpoints with this study about carrierâs behavior in fixing the T/S ports.
Kim(2011) wrote about the âFactors affecting T/S volume of Busan portâ. Writer insisted Port Infrastructure, Port cost, Port service level in Busan port have dynamic co-relationship with competing portâs scale of cargo volume, scale of trade volume and economic growth rate of competing countries. Writer viewed T/S cargo volume of Busan port increased when Export/Import cargo volume and trade volume in Shanghai and Tokyo grew. Therefore writer concluded that Busan port has to improve port infrastructure, enhance cost competitiveness and raise up port service through internal efforts together with endeavoring to attract more Export/Import cargo from shanghai and Tokyo in particular.
Ahn, Jun, and Yoon(2016) carried out the study on âStabilizing factors for stevedoring industry in Busan Portâ. Writers pointed out integration of terminal operator as the most important factor for enhancing competitiveness of Busan port. Along with integration writers also suggested âSize-upâ of operator for efficient responding to strengthening Allianceâs power and requirements as well. Furthermore writers diagnosed excessive competition among terminal operators for share of volume as the serious risk to be improved and recommended Port Authority to take actions immediately. Conclusionally, writers strongly criticized multiple terminal operator system in Busan port as the prominent risk and raised their voices for integration of terminal operator.
Park, Ahn, and Lee(2018) wrote about âReconfiguration effect of Busan port operatorâ. In this study, writers pointed out the problems in the present configuration of terminal operators in Busan port. As the problems in enhancing T/S competitiveness of Busan, writers pointed out Non-participation of terminal operation by global carriers, Non-operation by national carrier, High investment in terminal operation by pure Financial Investor, Multiple operator system as the factors deteriorating T/S competitiveness of Busan port and suggested imminent improvement plan: Integration of terminal operators, Attraction global carriers to dedicated terminal operation, Offering terminal operation to national carriers, Financial Investorâs share selling to Global carrier or GTO. In addition writers also studied âThe factors influencing T/S competitiveness of the portâ having location, network, service/productivity and cost competitiveness as variables and they confirmed that all the factors have strong relationship with T/S competitiveness of the ports and Busan port as well.
Seo(2018) studied about âT/S competitiveness enhancement plan of Busan portâ and put emphasis on the urgency of terminal integration in Busan port. Writer pointed out the importance of evaluation on the corporateâs value for fair integration in order to sustain long-termed effects of integration thereupon. About the order of integration, writer suggested to integrate Old port first and operational integration in New port should be done in advance before proceeding to complete Corporate integration for achieving outcomes in short period. Writer also asked Port Authority to actively intervene in the process of integration among terminal operators in the dimension of profitability and public aspects.
Kim(2018) studied âFactors affecting T/S cargo volume in Busan portâ having vessel operating cost, location of the port, ports volume in Northern China, Port operation efficiency and size of container ship as variables affecting T/S cargo volume in Busan port. Writer expressed T/S networks as the most affecting factor among 5 variables in increasing T/S cargo volume of Busan Port. Aside from the Networks, writer referred operational situation in Northern Chinese ports, Berth operation efficiency are affecting the T/S volume of Busan Port.
3. Modelling of Analysis
3.1 Research Model
In analysis, through AHP(Analytic Hierarchy Process) Model, to find which factors affect T/S competitiveness of the port and to compare the priority among them in the level of influence, 7 factors, Location, Network, Productivity, Infrastructure, Service, Port Authorityâs policy, Cost competitiveness, are assessed. The validity of these seven factors as analysis elements in evaluating the T/S competitiveness of the ports has been duly proved by the Theoretical backgrounds study and preceding researches in Chapter 2. Aside from the numerous preceding researches focused on the factors deciding T/S competitiveness, it was confirmed through the preliminary interview with the all the concerned parties before designing the survey in order to obtain more objective feedback.
3.2. Data collection and Analysis Method
For collecting the data and enhancing the accuracy of the analysis, survey and interview have been carried out together. Also in order to raise reliability of the survey, questionaire items have been modified after preliminary investigation about the questionaire. The survey has been carried out for a month, August 2020, targeting all the relevant parties, Global national carrier, Intra Asia carriers, Global foreign carriers, Terminal operators and Busan Port Authority, who are all eligible in evaluating T/S competitiveness in Busan port. Questionaire has been sent to 168 samples, thereafter, 163 samples timely answered while indicating 97.0% of high collection ratio and 162 samples proved to be effectively answered. The breakdown of pertinent groups is indicated at Table 13.
As a Methodology for this research AHP (Analytic Hierarchy Process) which is efficient tool to analyze the factors by determining hierarchy is used. The Analytic Hierarchy Process is a methodology for helping decision makers to make complex, multi-criteria decision12). Fig. 5 is the Model for analysis process.
4. Results of Analysis
4.1 Descriptive Statistics Analysis
4.1.1 Descriptive statistics for T/S competitiveness deciding factors
To confirm the seven factorsâ influence in deciding the competitiveness of T/S port, survey has been done and the results of it is indicated on Table 14
4.1.2 Busan Port Conformity results upon deciding factors
After the analysis for factors to confirm the influence in deciding the competitiveness of T/S port, Analysis, again, how Busan port, then, conforms to those factor is carried out. The results of analysis is indicated at below Table 15.
According to the results of analysis samples appeared to recognize that all the factors affect on the competitiveness of T/S port and this means Ports have to take those factors into high consideration if they have plan to develop their ports as T/S oriented ports.
4.2 Results of descriptive Statistics Analysis
4.2.1. Results of Pairwise comparison among factors deciding T/S competitiveness
For the analysis about the factorsâ value in deciding the T/S competitiveness, paired comparison among the factors is matrixed and weights of each factors are explained as Table 16.
Each factorsâ degree of importance average is calculated by the geometric average through AHP and to evaluate the credibility of response when CR(Credibility Ratio) value is higher than 0.1, response has been excluded to ensure credible value of response for precise analysis.
4.2.2. Weight Analysis for the comparative importance evaluation
Whereas, in comparative importance evaluation among factors, results of evaluation is indicated as Table 17. According to the results of analysis, Cost competitiveness has the highest value(0.1988) and thereafter, Location(0.1868), Port Productivity(0.1531), Network with overseas ports(0.1378), Port Infrastructure(0.1262), Port Service(0.1144), Port Authorityâs Policy(0.0829) are followed. The CR value of this analysis is 0.0015 which is lower than 0.1,hence, the results of analysis has high credibility.
5. Conclusion and Implications
According to the analysis, it was answered that all the 7 factors, Location of the port, Network with overseas ports, Port service, Port Authorityâs policy direction, Port productivity, Port infrastructure, Cost competitiveness of the port, affect T/S competitiveness of the port. Through the AHP analysis, whereas, Cost competitiveness of the port, among 7 factors, was analyzed as the most influencing factor in deciding competitiveness of the T/S port while Port Authorityâs policy direction was evaluated as the least influential factor. When looking at how far Busan Port satisfies these factors, location was found to be Busan Portâs most competitive advantage. Its cost competitiveness, on the other hand, was evaluated poorly ranking six among the seven factors for Busan Port.
It is simply indicating that Busan port has to improve cost competitiveness with highest priority to enhance T/S competitiveness. As aforementioned, the absolute cost level in Busan is not to be high, but, comparatively higher cost level than competing Chinese ports assumes to be felt high. More from it, additional cost burden raised from the separate terminal operation by which alliance fleets can not be accommodated within the contracted one terminal due to insufficient berth appears to explain the results of analysis. Meanwhile Network power of Busan was evaluated high overall and this can be explained by the locational characteristics connecting America, China and Japan who are sharing the T/S cargo of Busan more than 65% of entire volume of Busan.
Therefore, hereunder, this research suggests practical action plans how to enhance T/S competitiveness of Busan by correctly reflecting the results of the study.
Firstly, to raise up cost competitiveness, the most effective method is to integrate terminal operation, thereafter steadily move to complete corporate integration in the end. As explained in the chapter 2, Hongkong is the good example for this job. In the level of T/S cargo handling charge, Busan stands some expensive level than competing Chinese ports, however, this comes from distorted tariff structure of Chinese ports rather than Busanâs subjective high tariff rate. Therefore, to increase operational efficiency which off-sets the cost disadvantages could be smarter strategy than lowering the tariff rate to compete with Chinese ports.
Secondly, Attracting global carriers as terminal operators can be effective strategy in tightly holding them to Busan port. Most of the global carriers operate their own dedicated terminals in Shanghai, Ningbo and Qingdao who will fiercely compete with Busan for T/S cargo. If those ports redirect to attract T/S cargo from/to Bohai(Tianjin, Dalian) areas which are currently transshipped at Busan it will be very serious threats to Busan port. Because carriers give first priority to their own dedicated terminal when decides T/S port. Also in Alliance system, all the members belong to the same Alliance group use the same terminal and it accelerates volume increase pattern.
Thirdly, present Old port and New port, two ports, system should be restructured into single New port system through the stepwise shutdown of Old port. Two ports operation raised up several problems including social costs for traffic and air quality issues, in logistics more seriously, ITT between Old port and New port increases additional expenses for connection. With the shutdown of Old port New port expansion should go abreast to offset the berth supply shortage in New port.
Finally, Expansion of port infrastructure should be continued as planned. Especially, the 2nd New port project constructing additional 17 container berths should be undertaken as planned despite raised argument over optimum scale of berth supply in Busan port. The further infrastructure expansion in New port, on the other hand, may put the bigger leverage in handling old port shutdown issues and prepare for the change of operational type to automation and digitalization in near future. In the mean time, even if this research aims to verify the factors affecting T/S competitiveness of the port by focusing on Busan, the literary descriptions accompanied by the global instances is expected to provide overseas Port Authorities with high insights when they establish plan to develop their ports as T/S centered port as Busan. It is, however, this research has limitation in carrying out the survey with domestic samples. In future, if more extensive research reaching the overseas headquarters, it may suggest more abundant implications.

 PDF Links
 PubReader
 ePub Link
 Full text via DOI
 Download Citation
 Print
Print


