A Study on the Radar Operational and Technical Performance Requirements for Vessel Traffic Service
Article information
Abstract
With the expansion of the shipping and port logistics industry in the 21st century, the traffic density is continuously increased because of the increase in volumes of world sea freight and fleets, as well as the increase in the causes of potential marine accidents, such as ship collisions and stranding. Accordingly, the International Maritime Organization (IMO) has requested that the installation and operation of VTS should be applied in areas with high risk of marine traffic, and the request should be included as one of the Safety of Life at Sea (SOLAS) regulations. In this paper, the fundamental requirements of the radar system for vessel traffic services were analyzed and the analyzing factors were based on the IALA guideline.s This paper also includes results for the requirement and recommendation analysis on detection distance, target separation, and the target position accuracy of X-band radar. Also, to check if it satisfies the requirement of detection distance, range and azimuth separation of small point targets, and target position accuracy from the IALA guidelines, the test was conducted through the radar image acquired at the VTS center, and hence, the validity of the technical performance requirements was confirmed.
1. Introduction
The purpose of vessel traffic services is to improve the safety and efficiency of navigation, safety of life at sea and the protection of the marine environment and/or the adjacent shore area, worksites and offshore installations from possible adverse effects of maritime traffic(IMO, 1997).
International Association of Marine Aids to Navigation and Lighthouse Authorities(IALA) is a non profit organization established in 1957 to promote ship safety, economic navigational support and environmental protection through the coordination and enhancement of global Aids to Navigation(AtoN). The VTS Committee establishes guidelines on the operational and technical performance requirements of vessel traffic service(IMO, 2006).
The operational and technical performance requirements of the VTS systems are addressed in IALA Recommendation V-128, but have recently been revised to IALA Guideline 1111. In addition to the functional and performance requirements for the components of the various VTS systems, including radar, AIS, direction finder, VHF, this document provides guidance on the data processing capabilities and performance, user interface, and test validation that the VTS system must have.
In this paper, based on IALA Guideline 1111, the radar detection range, range separation, azimuth separation, and target position accuracy specifications of ship traffic control system are analyzed for the establishment of VTS radar facility management regulations in Korea. Tests on radar performance requirements from radar images collected at VTS centers were performed at Yeosu VTS centers using Odongdo radar, and the validity of the technical performance requirements has been confirmed.
2. Radar Performance Requirements Analysis
The IALA guidelines specify the operational and technical performance requirements of the various equipment that makes up the VTS system. Radar performance requirements are specified “X-band”, “S-band” in terms of frequency, and divided into “basic”, “standard”, “advance” according to performance.
Among the requirements for the operation and performance of the VTS system specified in the IALA guidelines, the performance requirements were analyzed focusing on the detection range, range separation, azimuth separation, and target position accuracy of the X band radar “standard” performance, which is mainly used in Korea.
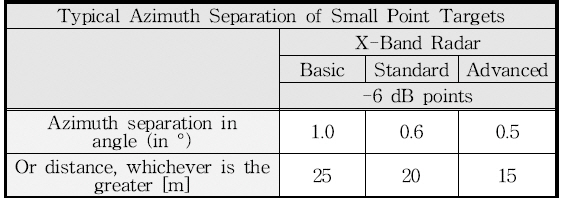
2.1 Target Separation
Table 1 and Table 2 show radar range and azimuth separation, respectively. The IALA guideline defines the interval between –6 dB of the peak and the reflected signal of two adjacent targets. The range separation and azimuth separation in the IALA guideline, respectively, are stated as follows(IALA, 2015a):

Typical range separation

Typical azimuth separation
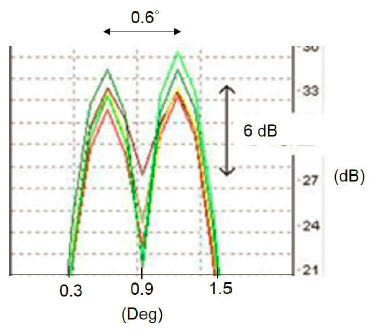
Fig. 1 shows the radiation pattern of Terma's 21-foot circularly polarized fan beam antenna(38 dBi), with the vertical axis in dB and the horizontal axis in degrees. The angle is indicated by a blue line at –3 dB and a red line at –6 dB, which is 0.36° at –3 dB and 0.6° at –6 dB.
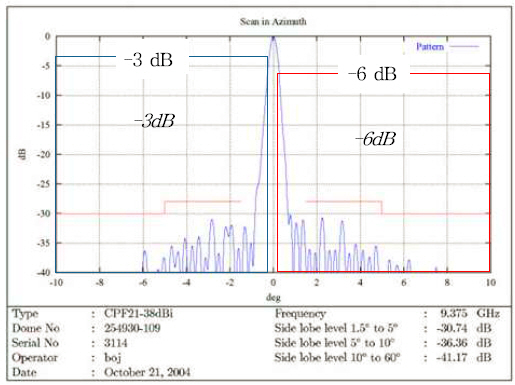
The Radiation Pattern of Terma’s 21 feet Circularly Polarized Fan Beam
As shown in Fig. 1, to give a little more space for azimuth resolution, we set the reference to –6 dB instead of –3 dB.
Fig. 2 shows the dip shape of radar. The beam width is 0.36 deg(-3 dB), and if you place two “patterns” side by side spaced only 0.36 deg, the “dip” between them is negligible and not really enough to interpret them as two.
The dip shape of radar
In order to have a distinct dip of 6 dB to allow seeing two targets, we need a bit more spacing than “just” the 3 dB beam width.
2.2 Target Position Accuracy
Target position accuracy refers to the position accuracy of the target extracted from the radar image. The target position accuracy requirements for the X-band radar are shown in Table 3(IALA, 2015b).

Typical target position accuracies
Target position accuracy includes errors due to quantization noise, target extraction errors, and inaccuracies in radar installation and calibration. The error due to the slant range according to the antenna height is not included(Miller, 1984).
3. Radar performance test
3.1 Radar detection range
The purpose of this study is to establish a VTS radar performance test procedure suitable for domestic conditions in consideration of the operation purpose of port and coast VTS, installation environment such as detection range and height of radar.
Radar detection range was conducted by an intuitive method of checking whether the vessel is displayed on the control screen for a vessel sailing a distance that meets the performance criteria table. However, the detection range according to water surface, weather condition and sea level is defined in the IALA guideline “Typical Range Performance Predictions for X-band Radar”.
The IALA guideline does not mention radar settings (pulse repetition frequencies: long, medium, short pluse, etc.). Above all, only three installation heights of 20m, 50m and 100m provide detection range, for example, in the case of a radar installed at 25 m or 300 m, the criteria are ambiguous.
Radar settings are not found in the IALA guidelines, but the pulse repetition frequency(PRF) has a significant effect on the detection range and range separation, and the horizontal beamwidth has a significant effect on the azimuth separation. However, each setting is correlated so that long pulses are advantageous for long range detection, but there are many virtual images such as sea reflections at a short distance and range separation is reduced. In the case of setting a short pulse, the short range detection is advantageous, but the detection distance is reduced(Barton, 1988; Rohan, 1983).
Therefore, since VTS needs to be able to discriminate each ship in the area with heavy traffic, short or medium pulses with low surface reflectance should be operated, and long distance measurement should be performed to measure the detection range by switching to a long pulse.
1) Maximum Detection Range
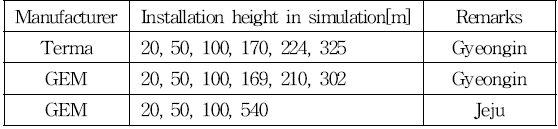
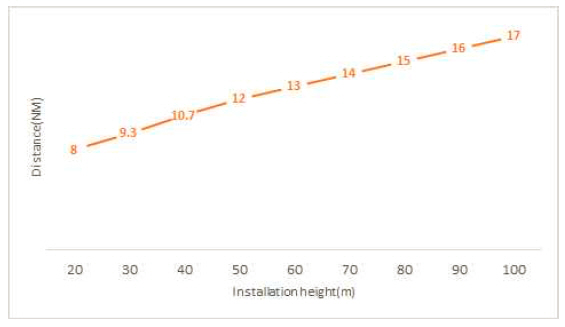
In order to prepare a range performance predictions table for heights other than 20m, 50m, and 100m, it is necessary to confirm the height to which the radar is installed. Radar installation heights in Korea is installed below 100m(58 places, 82%) out of 71 places nationwide, and most of them are installed at heights below 300m(70 places, 99%). This seems to be due to the fact that most VTS radars are installed offshore considering the detection range. Therefore, the radar range performance predictions test criteria table has been prepared up to 300m, which is 99% of the national radar(70 places). The range performance predictions for each height other than the three heights(20m, 50m, 100m) specified in the IALA guidelines can be obtained by calculating simulation data of the maximum detection range for each installation height submitted by the radar manufacturer in the domestic radar installation of Table 4. Trendline graphs were prepared, including the standards provided by 20m, 50m and 100m height, and the minimum values were calculated in 10 m units as shown in Fig. 3.

Simulation results obtained from radar manufacturers
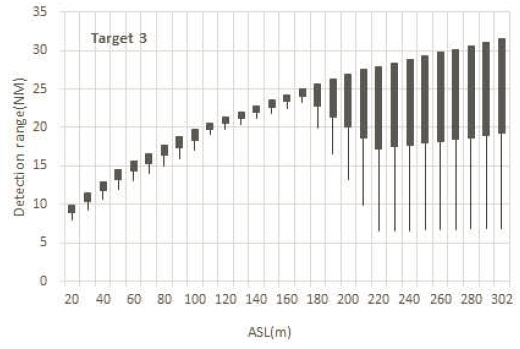
The graph of maximum detection range based on installation height including radar manufacturer simulation data
Fig. 3 shows the maximum detection distance for each installation height for a AtoN with a radar reflector corresponding to IALA Target 3(Radar Cross Section: 10㎡, ASL: 3m)(IALA, 2015c).
2) Minimum Detection Range
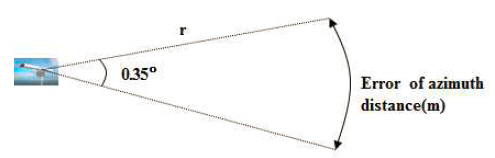
The minimum detection range of the radar over 100m that is not indicated in the IALA guideline was analyzed by the correlation between the minimum detection range and the installation height for each height below 100m in the IALA guideline.
Since the installation height and the minimum detection range are directly proportional to a certain angle (61.1°), the minimum detection range up to 300m in height can be obtained using Fig. 4.

A resemblance triangle for calculating the minimum detection distance
3.2 Range and azimuth separation
Typical range and azimuth separation is the ability to separate and display two or more targets without clumping on the control screen. In fact, ships cannot be sailed dangerously for test, so it is necessary to prepare a test environment with test targets.
1) Selection of test vessels
There is no description of the size of the test target in the IALA Guideline, but Table 1 and Table 2 indicate “range and azimuth separation of small point targets”.
Therefore, the Ministry of Maritime Affairs and Fisheries Notice No. 2014-154 “The Standard of Small Ships” refer to “Structure and Equipment Standard of Small Ships”, the Small Ships defines “ships less than 12m in length” in Article 2(Definition). To know the radar cross section(RCS) of a small ship, we compared the RCS values of the 12m small ship and reflector of 10㎡ , 100㎡ RCS which classified as “IALA Target Form” according to the IALA Guideline. The RCS of the 10 ㎡ radar reflector on the radar screen is similar to that of the 12 m small ship. Therefore a target 3 of 10 ㎡ or less is used as the test target(Fougias, 2011).
2) Test Methods
The test method was conducted by determining how far apart two test ships should be separated and checking whether two ships were displayed separately on the control screen.
In the case of distance resolution, the distance between two small objects is defined as three sections (less than 5 NM, more than 5∼20 NM, and more than 20 NM) according to the distance from the radar to the small object as shown in Table 1. Therefore, one of the three sections was selected according to the actual conditions such as ship traffic and maritime site safety, and two test vessels were positioned at specified intervals in a straight line from the radar to confirm that they were separated and displayed on the control screen.
In the case of the “standard” class of the X-band radar of Table 2, the larger of 0.6° or 20m is to be applied, so it is necessary to convert the angle 0.6° to distance meter.
To do this, we apply equation (1) to calculate the base length of an isosceles triangle, as shown in Fig. 5, where d is the distance between the vessel and r is the distance between the radar and the vessel. If the value d is less than 20m, 20m is applied, and vice versa, the distance meter corresponding to 0.6 ° is applied.

Detection distance between vessels for test
3.3 Target Position Accuracy
The target position accuracy was verified whether the actual position of the target and the radar image position match. Therefore, we select the fixed object on the chart that can confirm the actual position and check the actual distance and orientation from the radar to the target as shown in Fig. 6.
Distance and azimuth error for small point target
In Table 3, The angle 0.35° needs to be converted into the distance, because a larger value between 10 m and 0.2 % of the interval distance from radar to target is supposed to be applied for distance accuracy. A larger value between the distance corresponding to 0.35° and 10m is supposed to be applied for cardinal directions as well. For this purpose, the converted value obtained by equation (2) will be applied as 10m if the value is less then 10 m, and the value will be applied as the distance corresponding to 0.35° if the value is greater than 10 m.
4. Theoretical verification of detection range
Before conducting the test on Yeosu VTS Odongdo radar, we will theoretically verify the applicability of the maximum detection distance criteria in Fig. 3 through a simulation program. The simulation program used is the “CARPET(Computer-Aided RADAR Performance Evaluation Tool)”(Huizing, 2015).
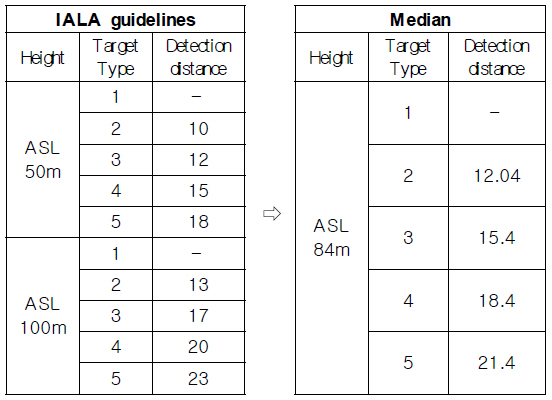
4.1 Detection distance of Yeosu VTS Odongdo Radar using the detection range reference table
Odongdo radar has an installation height of 84m(59m above sea level and 25m of steel tower), and the detection distance was calculated by calculating the median distance between the installation height of 50m and 100m in Fig. 3.
Fig. 7 shows a maximum detection distance of 15.4 NM for target type 3(RCS: 10 ㎡) with a radar installation height of 84 m.
Detection distance using Fig. 3(Target type 3)
4.2 Detection range using CARPET program
The CARPET program performed the simulation by using the radar parameters installed in Yeosu Odongdo.
1) Radar Antenna Parameters Applied to Carpet Program Execution
- PD : 80 %
- Pfa : 10-4
- Array length : 19 feet
- Polarization : circular
- Antenna turning speed : 11 rpm
- Processing gain : off
- Sea state : 6
- Weather conditions : clear
- Surface duct : no
- Waveguide loss : no
- Target types : 3
2) Transmitter and Receiver Parameters of Radar
- Transmitter peak power : 25 kW
- Pulse length : 0.5 us
- P.R.F. : 1.5 kHz
- Receiver BW : 2 MHz
- Swerling case : 1
Fig. 8 shows the simulation results for a radar reflector buoy with a 10 ㎡ radar cross section and a radar installation height of 84 m. As a result, the detection range was 16.8 NM and 1.4 NM(8.3 %) difference from 15.4 NM which Odongdo radar needs.
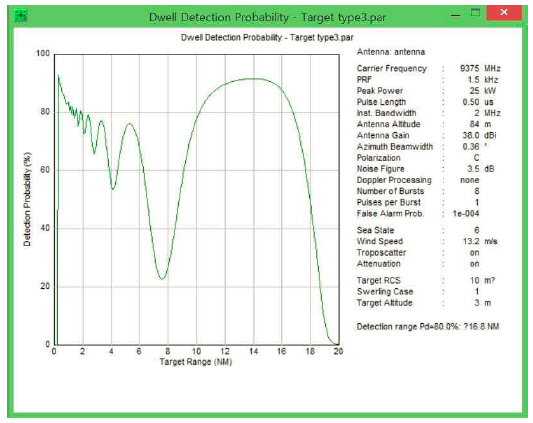
The results of simulation using CARPET
5. Performance test results.
5.1 Selection of performance test site.
Fig. 9 is selected as Yeosu VTS Odongdo Radar with less impact of swelling and wave height in the form of sea bay, close to the control center, radar(red dot) and marina(2 km).
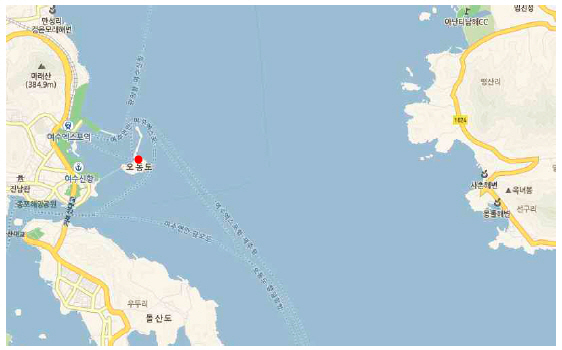
Radar site of Odongdo
5.2 Weather condition
The weather condition was confirmed by the Meteorological Agency's Geum-Odo, which was installed at the south of Odongdo radar about 11 NM, and the average wave height was good at 0.1 to 0.2 m.
Since the RCS(Radar Cross Section) value is highly dependent on the rapidly changing sea characteristics and target movement, the sea level should be considered. Douglas(GIT) Sea State around Odongdo is “1(smooth)” and is a good weather to test.
5.3 Test Targe
Fig. 10 shows the standardized 3rd target of the IALA guideline(the aids with the radar reflector) and has dimensions of ASL 3 m, RCS 10 ㎡(Aqua Mate Products Ltd., UK, Type: EM 230BR) and weight of 300 kg.
Aids to navigation with radar reflector
5.4 Performance test
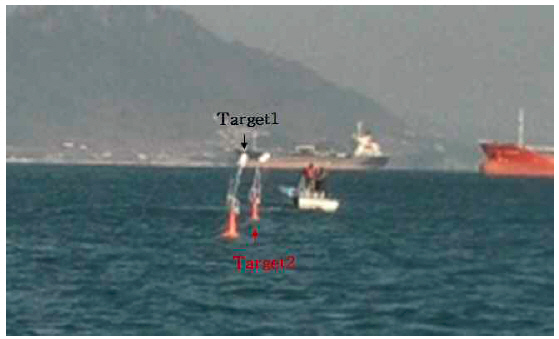
1) Azimuth separation
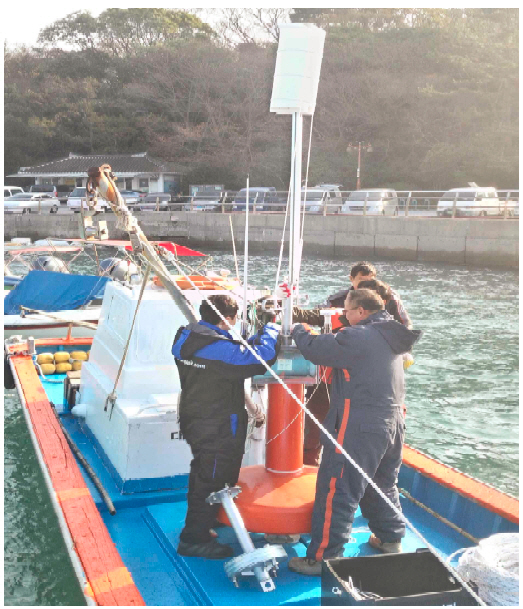
Two radar reflector buoys were installed at 0.67 NM in front of Odongdo, and a test was conducted to confirm whether the test object was separated on the control screen. Azimuth separation supposed to be applied for a larger value between the distance corresponding to 0.6° and 20 m, which is the “standard” performance of Table 2. Therefore Fig. 11 shows the installation of targets at 20m intervals.
Installed test AtoN for azimuth separation test
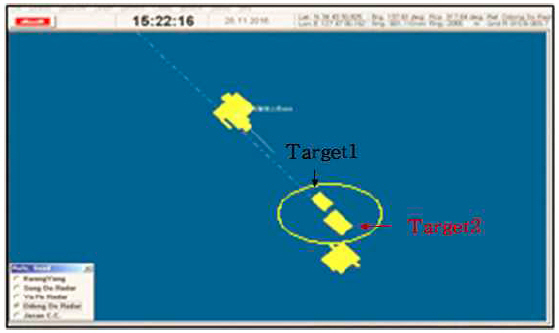
Fig. 12 shows two targets separated on the Odongdo radar control screen.

Results of azimuth separation test
2) Range separation
Two radar reflector buoys were installed at 1.1 NM in front of Odongdo, and a test was conducted to check whether the test object was separated on the control screen.
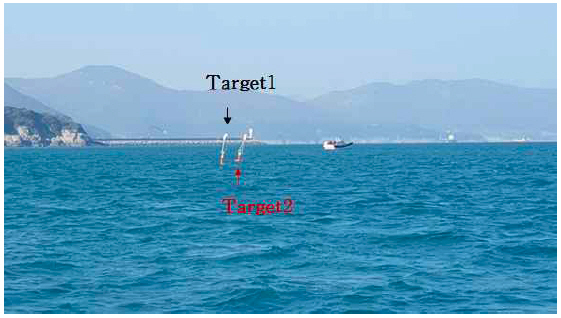
In Fig. 13, two radar reflector buoys were installed in a straight at 20 m intervals from Odongdo radar.
Installed test AtoN for range separation test
Fig. 13 shows two separate objects on the Odongdo radar control screen.
Results of range separation test
3) Radar Detection Distance
Since the small ship used for detection distance test is small, and it is difficult to navigate long distances due to the absence of radar and night navigation equipment, we decide to measure the maximum detection distance even for general ships sailing in the distant seas.
Table 5 shows the detection distance for each target type that corresponds to 84m, which is the installation height of the Odongdo radar, by calculating the intermediate distance between the radar height 50 m and the 100 m in the IALA guidelines.

Calculation of Detection Distance[NM]
As a result of confirming the specification of Samilho located at the outermost part of the radar image detected on the control screen, the total tonnage of 302 ton sand carrier was 122m in length and 8m in height. The radar reflecting area corresponds to the target type 5 of the detection range reference table because the radar reflecting area is 100∼1,000㎡(6∼10m ASL) according to IALA guideline “IALA target type”(IALA, 2015d; Fougias, 2011).
Fig. 15 shows that the ship on the control screen satisfies the performance criterion of 21.4 NM because the ship is sailing outside 23.5 NM from Odongdo radar.
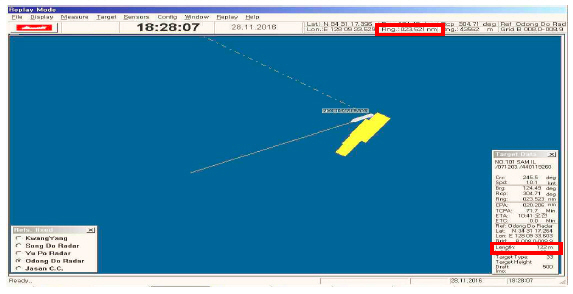
Results of detection distance test
4) Target Position Accuracy
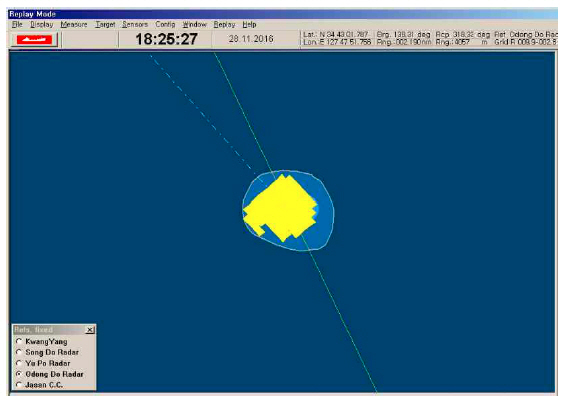
Fig. 16 shows the Uam lighted beacon of the Yeosu Sea Bay, a fixture that can identify its actual position on the chart. The right position of the Uam lighted beacon(34° 43' 01.7, 127° 47' 52.2) is 4,057 m, 138.05° from Odongdo radar, and 4,057m, 138.31° by radar image. The distance difference between the Uam lighted beacon position and the radar image is 0 m and the azimuth difference is 0.26°.

Actual position of Uam Lighted Beacon
The distance error range is to apply the larger value of 10 m and 0.20 %(radar to object distance, 8.1m = 4,057m × 0.2%) in Table 3, so the calculated result is within the error range as shown in equation (3).
Since the azimuth error range applies a larger value (0.35°) among 10 m and 0.35°(24m), Equation (2) is applied to convert 0.35° to distance for comparison.
As a result, since the distance corresponding to 0.35° is greater than 10 m, when the error range is applied to 0.35°(24.76 m), the azimuth difference between the actual position of the Uam lighted beacon and the radar image position is 0.26 °, so Fig. 17 shows that it is within the margin of error.
Radar view of Uam Lighted Beacon
6. Conclusion
The requirements for the operation and performance of the VTS system specified in the IALA guidelines, Among the requirements were analyzed focusing on the detection range, distance, azimuth resolution, and position accuracy of the X band radars used in Korea.
In addition, a verification process was conducted to establish parameters of detection distance, distance and azimuth separation, and target position accuracy for practical application of the guidelines presented by IALA in various marine environments.
Such verification should be continuously conducted to improve the quality of actual operation by applying more detailed parameters. Also, by establishing hypothetical fundamental elements and strengthening computer-based software, the future growth engines will be developed by strengthening the actual measurement activity by hypothesis. It is expected to be the basis for making a part.
Acknowledgements
This study was part of the results of the research conducted with the support of the Korea Coast Guard(Ministry of Public Safety and Security), and thank to the Yeosu VTS Center and IMICT Co., Ltd. for helping with the experiment.