A Study on Competitiveness of Major Container Terminals in Korea and China using FCM and TOPSIS
Article information
Abstract
Container port is one of the most vital link of the transportation chain that plays an important role in trading with other countries. Having a proper understanding of port operations could change the role of the port from a transportation node to an efficient point in a transportation chain. Development of transportation chains, logistics and progress of these networks have enhanced the sustainable condition and level of transportation. Therefore, evaluating the competitiveness of ports is obligatory for port users to make a decision in investment or exploitation. This paper introduces the use of Fuzzy C-means and TOPSIS for competitiveness comparison among a sample of container terminals in Korea and China and determine how to improve Korean port competitiveness and particularly in Busan port.
1. Introduction
The global trade volume has been steadily increasing in the rapidly changing environment since the financial crisis in 2008. Especially, the port facilities and competitiveness of major ports in Northeast Asia have been increasing in importance, especially in China, which is growing rapidly. In addition, only port harboring high competitiveness compared to other ports can survive the competition due to the enlargement of container ships, the upgrading of loading equipment, the globalization of port operations, and rapid technological change.
However, container-shipping volume in the Pacific Rim and Northeast Asia has increased in the globalization era, and international large port facilities of Northeast Asian countries such as Korea and China are in short supply. Therefore, Korea and China have rapidly expanded their large-scale port facilities, and are pursuing various port development policies to create cargo demand and improve port competitiveness.
Ports are indeed infrastructure facilities that are likely to create added value as they play an important role in the movement of goods, and port competitiveness is a criteria for ship owners and shippers to select ports. Due to such changes in the world economy and changes in the maritime port environment, the center of the world economy has been transferred from America and Europe to the Northeast Asia region. However, in recent years, over-investment has been caused by competition between ports and ports in some regions, and the inefficient operation of port facilities is serious.
The Hanjin incident greatly affected the structure and operation of Korea's ports, especially at the Port of Busan. Therefore, it is important to identify the evaluation factors of the competitiveness of container terminals in Korean port and to implement a comprehensive port policy to strengthen port competitiveness. In addition, it is urgent to set up a way to enhance the competitiveness of the port by comparing the strengths of terminals and complementing weak points
Therefore, this study identifies the key evaluation factors of port competitiveness as a case of container terminal in Korea and China and suggests an important port policy direction to strengthen the international competitiveness of Korea Port. The research is structured as below:
The first chapter presents the introduction to the issue of concern, which states the scope and objectives of research as well as the organization of the research content. The second chapter lists out prior research works in this field and ones applying the same study method. It also points out the superior points of this work over the previous literature. Additionally, investigate the main factors for evaluation of port competitiveness through previous literature review. The third chapter is an illustration of theoretical basic including entropy, Fuzzy c-means clustering and TOPSIS and establishes an integration model of FCm clustering and TOPSIS algorithm. The forth chapter analyses the current status of port competition and a result of application of model in case study of Korean and Chinese container terminals. The last chapter summarizes the methodology and the empirical findings of this paper.
2. Literature Review
Port competitiveness has been defined by academics in several ways. Port competitiveness has led to competition between ports and it has a competitive advantage. In other words, it shows a criterion to ship owners and shippers for selecting port through various functions for competitive advantage. Therefore, it can be utilized as an indicator that preparing a countermeasure because it identify the opportunities and threats of port.
Song and Yeo(2004) argued that the main factors influencing competitiveness of ports are port throughput, port facilities, geopolitical location of port and the service level of port by AHP. Yap et al.(2006) analyzed port relationship of 5 ports in East Asia (Hong Kong, Busan, Kaohsiung, Shanghai, and Shenzhen) through main port connectivity’s factors.
Nguyen et al.(2016) imployed Hierachical Cluster Analysis to classiffy 11 container terminals in Northen Vietnam by 7 selected factors namely throughput, number of berth, berth length, berth maximum draft, container yard square, medium vessel size and average handling productivity. Den at al.(2016) selected annual container throughput as an output and total terminal area, quay length, quay equipment, yard equipment, storage capacity, depth alongside, handling capacity as input to evaluate the relative efficiency of Russian and South Korean seaport from 2012 to 2014 by DEA model.
Saeed(2009) presented the results of an empirical study conducted by distributing questionnaires to shipping agents working for foreign principals in Karachi, Pakistan. In this study, a linear model is developed in which the dependent variable is total stay in port. The independent variables are vessel type, vessel size, total TEUs, vessel frequency and past visits of the shipping line. All the coefficients are significant.
To identify and evaluate the competitiveness of major ports in the region, Yeo et al. (2008) identified the components influencing their competitiveness and presents a structure for evaluating them. Based on the literature related to port selection an competition, a regional survey of shipping companies and owners to reveal that port service, hinterland condition, availability, convenience, logistics cost, regional center and connectivity are the determining factors in container ports in Korea and China.
Via an investigation of existing previous researches, Tongzon(2009) dertermined factors on port choice, namely high port efficiency, good gepgraphical location, low port charges, adequate infrastructure, wide range of port services, and connectivity to other ports. Adequate infrastructure played an important role on the port selection.
Chou(2010) presented first the canonical representation of multiplication operation of three fuzzy numbers, and then this canonical representation was applied to the selection of transshipment container port. Based on the canonical representation, the decision maker of shipping company can determine quickly on the ranking order of all candidate transshipment container ports and select easily the best one among them.
By using TOPSIS and AHP, Sayareh and Alizmini (2014) discovered that the working time, stevedoring rate, safety, port entrance, sufficient draft, capacity of port facilities, operating cost, number of berths, ship channelizing, and international policies are significant factors for selecting container seaport in the Persian Gulf.
malchow and Kanafani(2001) have identified the factors affecting port selection for US export cargo liners and found that oceanic and inland distances affect port selection negatively. murphy also investigated a series of port selection criteria from the perspectives of different market players such as ports, carrier, freight forwarder, larger and smaller shippers in US.
Lirn et al.(2004) have selected 47 criteria from a literature review and conducted two rounds of Delphi surveys involving experts industry and academic. Using AHP analysis, the results revealed that attributes such as handling cost, proximity to main navigation routes, proximity to import/ export areas. Infrastructure condition and feeder network are the most important service attributes of transshipment ports.
Ready information, availability of port-related activities, port location, port turnaround time, facilities available, port management, port costs, and customer convenience, were considered by Ha(2003) as 7 important factors of port selection in his extensive comparative evaluation of service quality factors
This paper intends to expand previous research studies by separating 2 large categories namely port physical and financial criteria for analyzing container port competitiveness in Korea and China.
Physical Criteria(2016) : Handling capacity (thousand TEU), the number of berth, berth length (m), total area (m2), number of quay crane, number of transfer crane, depth(m).
Financial Criteria(2016): total revenue (thousand USD), net profit (thousand USD), total asset (thousand USD), ROE, ROA.
3. methodology
3.1 Shannon Entropy for Weighting indexes
Step 1: Normalize the decision matrix
Step 2: Calculate the information entropy :
In order to avoid the insignificance of fij we stipulated :
Set di = 1-ei, i = 1,...,m as the degree of diversification
Step 3: Calculate the weight of entropy (the degree of importance of attribute i)
3.2 Overview of Fuzzy C-means Clustering
Fuzzy C-means (FCm) is a method of clustering which allows one piece of data to belong to two or more clusters. This method (developed by Dunn in 1973 and improved by Bezdek in 1981) is frequently used in pattern recognition. It is based on minimization of the following objective function
Where:
N and C are respectively the number of data and clusters, xi is the ith data, m is the fuzzier which determine the level of cluster fuzziness. Higher m infers fuzzier the partition, cj is the centre of the jth cluster, uij is the membership degree of xi belonging to the cluster, ∥*∥is the Euclidean vector norm expressing the distance between jth cluster’s center and ith data.
Fuzzy clustering is done throughout an iterative optimization of the Jm, with the update of uij and cj by:
The iterative steps used in obtaining optimal solutions are as follows: (1) Randomly initialize cluster centers, (2) Calculate membership value uij, (3) Calculate new cluster center, (4) Update uij, (5) Calculate Jm, (6) Repeat step 3-5 until improves by less than a specified minimum threshold or until a specified max number of iterations.
3.3. Overview of TOPSIS
The Technique for Order of Preference by Similarity to Ideal Solution (TOPSIS) is a multi-criteria decision analysis method, which was originally developed by Hwang and Yoon is 1981 with further developments by Yoon in 1987, and Hwang, Lai and Liu in 1993. TOPSIS is based on the concept that the chosen alternative should have the shortest geometric distance from the positive ideal solution (PIS) and the longest geometric distance from the negative ideal solution (NIS). It is a method of compensatory aggregation that compares a set of alternatives by identifying weights for each criterion, normalizing scores for each criterion and calculating the geometric between each alternative and the ideal alternative, which is the best score in each criterion. An assumption of TOPSIS is that the criteria are monotonically increasing or decreasing. Normalization is usually required as the parameters or criteria are by a good result in another criterion. This provides a more realistic form of modelling than non-compensatory methods, which include or exclude alternative solutions based on hard cut-offs.
The TOPSIS algorithm can be described by the following steps :
Step 1 : Construct the Initial matrix
In this step, it is listed in the attributes depending on the type of them by a matrix. Initial matrix X is as follows :
Step 2 : Construct the Normalized matrix
It transforms various dimensional attributes into non-dimensional attributes, which allows to compare among criteria in this step. Normalized matrix P is as follows
Step 3: Construct the Weighted Normalized matrix
Where wj is the weight given to the indicator pj, j=1,2,..., n
Step 4 : Determine the positive-ideal and negative ideal solutions.
Positive ideal solution :
Negative ideal solution :
Where I is associated with benefit criteria, and J is associated with cost criteria.
Step 5 : Calculate the Distance measures
Calculate the Distance measures using the m-dimensional Euclidean distance. The separation of each alternative from the ideal solution is:
The distance from the positive ideal alternative is:
The distance from the negative ideal alternative is:
Step 6 : Calculate the Relative Closeness to the ideal solution
The relative closeness of the alternative with respect to S+ is defined as
Step 7 : Rank the Preference Order
In this step, the decision-maker selects the high ranked alternative by comparing the relative closeness values. The larger the value Ci the better the alternative Si. The best alternative is the one with the greatest relative closeness to the ideal solution.
3.4 Process of integration model
The analysis is carried out for 3 different multiple-criteria scenarios. First, for the two perspectives – physical, and financial criteria separately, the all of them taken together. The all-together scenario involved considering all 12 performance measures simultaneously.
The steps for proposed process are described as follows:
Step 1: Normalizing and Weighting port data with entropy method.
Step 2: Clustering 33 terminals into 3 groups with FCm for each multiple-criteria scenario.
Terminals with similarity regarding weighted data have been clusted in groups. For this FCm algorithm has been used. In fuzzy c-means algorithm, the number of clusters, (c), should be determined first. In this research, 3 clusters were selected.
Step 3: Determines the ranking of the clusters using TOPSIS.
These rankings are determined by computation of closeness coefficients using TOPSIS algorithm. The centroids of the clusters provide the information needed for this analysis. As a result, we can determine what is the best cluster, worst and medium cluster.
Step 4 : TOPSIS is again used to determine terminal ranking with each of the clusters.
Here the closeness coefficient is used to determine the ranking of the terminals. A high value of the closeness coefficient denotes that its corresponding terminal is relatively farther from the negative point and thus has more desirable qualities and hence should receive a higher ranking. Now we can obtain overall ranking based on financial perspective (or physical perspective for example), by keeping in mind the ranking of clusters and the ranking of the terminals in those clusters.
Step 5: Using TOPSIS to determine complete overalls rankings for the 33 terminals under all three perspectives and also with all criteria together
Table 1 shows list of selected terminals in this research.

List of major container terminals in Korea and China
4. Application of model and Result analysis
4.1 Analysis on port competitiveness by Port Physical criteria
After standardized data, we calculated the weighted normalized matrix of terminal, which was showed in Table 2, by using entropy method, equation (1), (2). (3), (4) Weights are the way to express decision makers prefer on the criteria. It also represents the important level of factors. Therefore, factors having higher weight will be more important than low weight factors. In this case, weight of handling capacity criteria take a highest value 0.231 means the port handling capacity criteria is the main factor and it determines 23.1% of the terminal's competitiveness ranking.

The weights of port physical criteria
The result from application of the FCm algorithm to the physical criteria shows the list of member of each cluster as below:
Cluster 1 : SGICT, SCT, CCT, YICT, QQCT
Cluster 2 : PNC, SSICT, SECT, SmCT, NBSCT, NBCT, NGT, YZCT, CmICT, GOCT, DICT, DCT
Cluster 3 : HBCT, DPCT, PNIT, HJNC, KIT, DKCT, CJKE-GY, ICT, SNCT, E1CT, CJKE-IC, SPICT, TCT, TACT, XSCT
The next step determines the ranking of the clusters. These rankings, presented in Table 3, are determined by computation of closeness using TOPSIS algorithm (equation 16). The centroids of the clusters provide the information needed for this analysis.

Ranking of clusters by TOPSIS for physical criteria
As a result, the closeness coefficients indicate that the most desirable cluster is cluster 1 followed by cluster 2 and 3. It means terminals that belong to cluster 1 will have highest competitiveness in terms of physical criteria, in the other hand, terminals in cluster 3 have the lowest competitiveness.
In Table 4, TOPSIS was again used to determined terminal ranking within each of clusters.

Ranking of terminals within clusters by TOPSIS for physical criteria
From the Table 3 and 4 it is witnessed that 15 percent of terminals belong to cluster 1, the highest competitiveness cluster, 33% in cluster 2 and cluster 1 which has least competitiveness, has 52% terminals. There are only 5 terminals in cluster 1 but all are Chinese terminals, in which YICT of Shenzhen port ranked number 1 followed by SCT, CCT of Shenzhen, SGICT of Shanghai and QQCT of Qingdao port.
PNC of Busan port is the terminal having best facility condition in Korea. It is the only one belongs to cluster 2, others are in cluster 3.
In cluster 3, while terminals of Busan port and terminals of small-middle scale Chinese ports have high postion on physical competitiveness, terminals of Icheon and Gwangyang port have lower rank.
4.2 Total port competitiveness analysis
In the same way, the competitiveness of the port financial criteria is analyzed as shown in Table 4 above. Table 5 shows that port facility factors at Korea terminals are lower than those of China terminals. One of the important criteria in the transshipment is the securing of sufficient facilities. In this regard, it is considered to be a priority to improve the competitiveness of the port facilities of PNC. In the case of Chinese ports, the port physical criteria also has competitiveness on the basis of port throughput, which gives major implications for the Busan port policy, which is aimed at transshipment hub port in Northeast Asia. It is necessary to strengthen the competitiveness of the transshipment volume through the enhancement of competitiveness through the expansion of the port facilities mentioned above and to establish a strategic approach to prepare for the reorganized shipping alliance. In the case of the new port, it is considered that there is room for a rebound in competitiveness in terms of port throughput volume and port facility factors. Therefore, financial factors are also expected to increase competitiveness over time.

Ranking for different perspective using FCM and TOPSIS
Next, the competitiveness of financial factors shows that the operator of Chinese Ports is more competitive than the operator of Korean Ports. This indicates that terminals of Shanghai, Shenzhen and Qingdao port is stable due to the high freight volume and the competitiveness of the port facilities. On the other hand, in case of the Busan port terminal, the operator of North port is deteriorating due to the relocation of the port to the new port due to the redevelopment of the North port. In the case of new port operators, it seems that additional time is still needed until financial stabilization is achieved after opening.
Looking at the overall competitiveness of the terminals, overall, Chinese Port is more competitive than Korean Port In particular, SSICT, SGICT of Shanghai port, QQCT of Qingdao port are the top three terminals. YICT ranked first terminal in port physical category and ranked 8 terminal in port financial category. QQCT ranked first port in port financial category, second port in physical category. SSICT ranked second port financial criteria, ranked sixth port in physical criteria. meanwhile SGICT was ranked as third port in financial criteria, and ranked fiveth port in physical criteria. This reflects the current situation in which most of the cargo throughput volume at Shanghai and Shenzhen port, which is the No.1 and No.2 port in the Top world throughput, is being handled at Yangsan terminal (SGICT, SmCT) and Yantian international terminal.
On the other hand, as in the figure 1, the competitiveness of Korean port's terminals (black colour) is much lower than that of China port terminals (light grey colour). Only the highest ranking terminal of Korean – PNC belong to Busan New Port is on the top 10 best terminals. However, as mentioned above, the new port is still in the stabilization phase since it has just been opened, and after the stabilization has been completed and the shutdown of the north port terminal has been completed. Therefore, it seems that BPA (Busan Port Authority) and other port authorities need to implement policies to cope with the current situation and the future situation in different directions for North port and new port terminals.
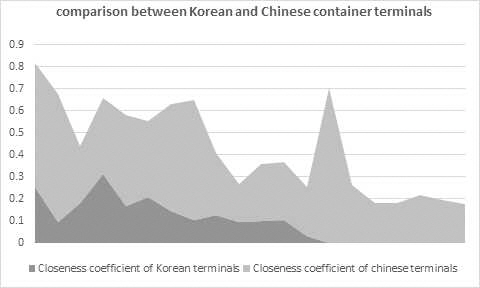
Comparison among korean and chinese container terminals
5. Conclusion
This study analyzed and compared the competitiveness among Korean container terminals and Chinese container terminals with two factors by applying integration model of TOPSIS and FCm. In conclusion, the factors that may affect the competitiveness of ports are closely related to each other. As a result, although Busan is a biggest port of Korea, the competitiveness of Busan Port and China Port has a big difference. The Port of Shanghai is the world's No. 1 container handling port, and container traffic growth at Busan Port is slowing. In addition, it is meaningful to look at the competitiveness of Korea port by container terminal at present, where various negative factors such as the Hanjin Shipping situation are overlapping. Although the competitiveness of Busan port was lower than that of Shanghai port, inefficiency of port operation was serious due to excessive investment due to excessive competition between Busan terminal operator and new port. Busan port was ineffective in transshipment port and international logistics hub port. The international status has been lowered, and the recent growth rate has also slowed compared with the competitive international port. Gwangyang and Incheon port lower rank in every category because competitiveness of near ports ( Dalian, Tianjin and Qingdao) has risen. It can be forecasted that competitiveness of Incheon and Gwangyang port will be weaken increasingly.
Because of China’s economic development and continuous investment, Chinese ports have grown rapidly on port facilities and financial part. meanwhile, in Chinese ports, it has port competitiveness of small and medium –sized ports because efforts of Chinese government’s port integration policy.
Under these circumstances, for Busan Port to grow into the 4th generation port, the port competitiveness strengthening measures should be promoted in order to attract voluntary participation of world shipping companies in the development of port hinterland. In addition to establishing an international logistics network in the port, it should develop into a sustainable green port. In order to do this, it is urgent to identify the evaluation factors of the competitiveness of Busan Port and to develop a comprehensive port policy for each terminal to enhance port competitiveness.
Busan Port, which is experiencing an increase in transshipment rate and slowing increase in trade volume, should concentrate on securing the network and route of ports that are in danger due to expansion of port facilities and the situation of Hanjin based on this study. Also, since the reorganization of shipping companies that use the new port after the Hanjin Incident is in progress, THE Alliance and OCEAN Alliance will be launched in April 2017. In addition, the current situation, in which looms for port in North China are increasing, is likely to be a barrier to new attraction as well as concerns about the departure of transshipment volume of Busan port. In addition, the long-term fixation of the service change due to the long-term agreement of the OCEAN Alliance, which is maintained for 10 years, further lowers the possibility of reintroduction of the transshipment cargo in the abandoned Busan Port.
The result of these efforts is reflected in the competitiveness of Busan port. Also, because port strategy is divided into each port now, it is necessary to implement the selection and concentration strategy through more detailed analysis. In addition, it needs to establish the different role played by Busan and Gwangyang port and preparing a port integrated system.
Acknowledgement
This research is part of the project titled “SmART-Navigation project” funded by the ministry of Oceans and Fisheries.